There is some information that hardly any investors seem to know – and yet it is so valuable!
As such, I would like to share this information with you today. It is highly relevant at the start of the year 2025.
Have you ever considered that whether a year ends in an odd digit (like 5 at the end of 2025) might make a big difference in some markets?
These differences exist in the shares of small companies, such as those included in the Russell 2000 – and they are in fact big differences!
The Russell 2000 in even years
As you may know, in 2024 the Russell 2000 performed worse compared to the wider market.
2024 ends with the even number 4.
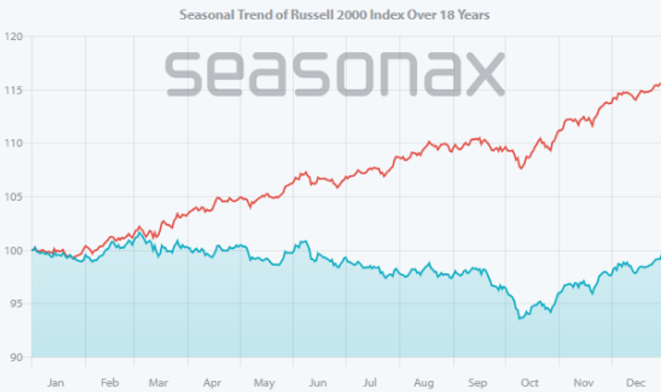
So, let’s look at the seasonality of the Russell 2000 only in years that end with an even digit. The chart below shows you the seasonal trend over every even year in the past 37 years, (i.e in 18 years in total).
For comparison, I have drawn the seasonal trend of the S&P 500 in the same years as a red line.
Russell 2000, seasonal trend only in the even years (blue) compared to S&P 500 (red)

The deviation is significant. Source: Seasonax
As you can see, the performance of small companies in the Russell 2000 in even years is far worse than that of the medium and large companies in the S&P 500.
The deviation widens steadily from March to October.
This is a remarkable phenomenon, and yet one that hardly any investors are likely to be aware of!
From a seasonal perspective, it was therefore to be expected that the Russell 2000 would perform worse than the S&P 500 in 2024.
The Russell 2000 in odd years
But what about years that end with an odd number?
2025 ends with 5, an odd number.
So let’s now look at the seasonality of the Russell 2000 but only in years that end with an odd number.
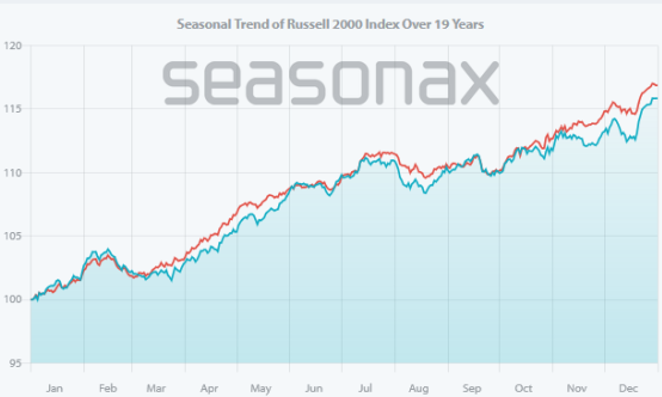
The next chart shows the seasonal trend over the other half of the past 37 years i.e. over 19 odd years.
For comparison, I have drawn the seasonal trend of the S&P 500 for the same years, again as a red line.
Russell 2000, seasonal trend only in odd years (blue), S&P 500 in odd years (red)

The deviation has disappeared. Source: Seasonax
As you can see, the performance and seasonal trend of the Russell 2000 in odd years is roughly comparable to that of the S&P 500.
While the prices of small companies perform far worse than medium and large companies in even years, there is hardly any difference in odd years.
Don’t you find this difference between odd and even years astonishing?
Although 2024 ended with an even number and the Russell 2000 performed weaker than the S&P 500, 2025 is now an odd year.
Is it therefore time to consider small companies for 2025?
I think so!
—
Originally Posted January 8, 2025 – 2025? This Market Performs Well in Odd Years!
PS: You can find the filter for odd and even years in the Seasonax filter section under “More”.
PPS: The Seasonax team wishes you a happy, healthy and joyful 2025!
Disclosure: Seasonax
Past results and past seasonal patterns are no indication of future performance, in particular, future market trends. Seasonax GmbH neither recommends nor approves of any particular financial instrument, group of securities, segment of industry, analysis interval or any particular idea, approach, strategy or attitude nor provides consulting nor brokerage nor asset management services. Seasonax GmbH hereby excludes any explicit or implied trading recommendation, in particular, any promise, implication or guarantee that profits are earned and losses excluded, provided, however, that in case of doubt, these terms shall be interpreted in abroad sense. Any information provided by Seasonax GmbH or on this website or any other kind of data media shall not be construed as any kind of guarantee, warranty or representation, in particular as set forth in a prospectus. Any user is solely responsible for the results or the trading strategy that is created, developed or applied. Indicators, trading strategies and functions provided by seasonax GmbH or on this website or any other kind of data media may contain logical or other errors leading to unexpected results, faulty trading signals and/or substantial losses. Seasonax GmbH neither warrants nor guarantees the accuracy, completeness, quality, adequacy or content of the information provided by it or on this website or any other kind of data media. Any user is obligated to comply with any applicable capital market rules of the applicable jurisdiction. All published content and images on this website or any other kind of data media are protected by copyright. Any duplication, processing, distribution or any form of utilisation beyond the scope of copyright law shall require the prior written consent of the author or authors in question. Futures and forex trading contains substantial risk and is not for every investor. An investor could potentially lose all or more than the initial investment. Risk capital is money that can be lost without jeopardizing ones’ financial security or lifestyle. Only risk capital should be used for trading and only those with sufficient risk capital should consider trading. Past performance is not necessarily indicative of future results. Testimonials appearing on this website may not be representative of other clients or customers and is not a guarantee of future performance or success.
Disclosure: Interactive Brokers
Information posted on IBKR Campus that is provided by third-parties does NOT constitute a recommendation that you should contract for the services of that third party. Third-party participants who contribute to IBKR Campus are independent of Interactive Brokers and Interactive Brokers does not make any representations or warranties concerning the services offered, their past or future performance, or the accuracy of the information provided by the third party. Past performance is no guarantee of future results.
This material is from Seasonax and is being posted with its permission. The views expressed in this material are solely those of the author and/or Seasonax and Interactive Brokers is not endorsing or recommending any investment or trading discussed in the material. This material is not and should not be construed as an offer to buy or sell any security. It should not be construed as research or investment advice or a recommendation to buy, sell or hold any security or commodity. This material does not and is not intended to take into account the particular financial conditions, investment objectives or requirements of individual customers. Before acting on this material, you should consider whether it is suitable for your particular circumstances and, as necessary, seek professional advice.

