Earnings for 4Q23 are almost complete. Most companies came in at or a few per cent ahead of market expectations. Cheniere (CEI) beat sell-side estimates by 11%, continuing a remarkable run. They are targeting a 1:1 ratio between buybacks and debt reductions and based on their long run desired share count should be retiring 12-13% of outstanding shares over the next few years.
CEI’s FY2023 EBITDA came in at $8.77BN. The stock dipped last week as 2024 EBITDA guidance came in a little below expectations at $5.5-6.0BN. Last year they benefitted from large regional price differences in natural gas on the portion of their LNG capacity not committed under long-term agreements. They have not assumed the same opportunity this year. Despite CEI’s flat stock performance over the past year, JPMorgan and Wells Fargo continue to rate them Overweight. It’s one of our bigger holdings.

Plains All American (PAGP) came in 10% ahead of expectations as their crude oil and Natural Gas Liquids segments both reported strong results. They increased their distribution by 19%.
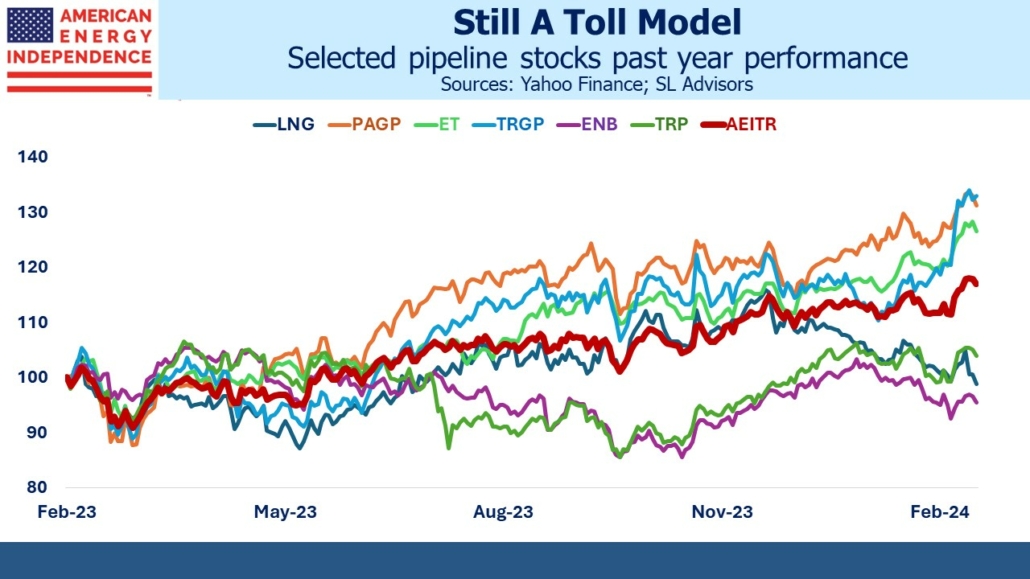
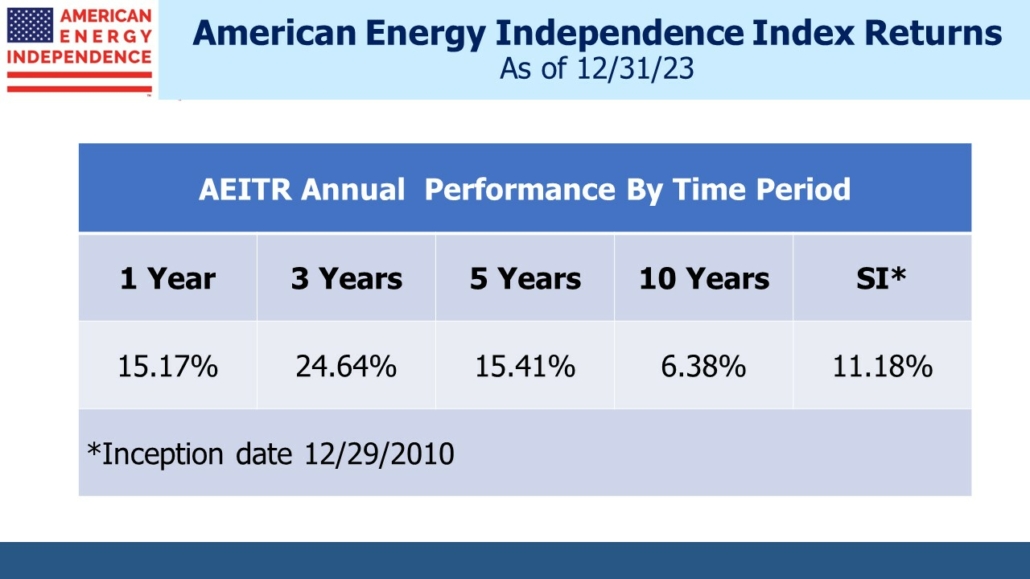
PAGP stock has performed strongly in the past year, +31% versus the American Energy Independence Index (AEITR) at +17%. We tend to underweight crude oil businesses in favor of natural gas where we believe the long-term growth prospects are more assured. Nonetheless, the softening of US demand for electric vehicles will encourage the view that US crude oil demand is not going to fade away.
Energy Transfer’s (ET) 4Q EBITDA came in close to consensus at $3.6BN. However, 2024 EBITDA guidance was slightly below expectations while capex was somewhat higher. The stock remains attractively priced in our view, and any disappointment over the guidance was short-lived. It’s up 26% over the past year, including that high dividend which currently yields 8.4% and is covered 2X by Distributable Cash Flow (DCF). ET is rated Overweight at JPMorgan and Wells Fargo.
Targa Resources (TRGP) is another strongly performing stock, +33% over the past year including its low dividend which currently yields 2%. TRGP is well positioned to transport NGLs from the Permian to export terminals on the Gulf coast, providing an integrated service to customers with multiple opportunities to add value.
JPMorgan expects 9%+ EBITDA growth this year and next. With management committed to returning 40-50% of cash from operations to shareholders via dividends and buybacks, there is plenty of room for TRGP to increase its quarterly payout.
The Canadians have been lagging the sector because of market concerns about their capex. Enbridge’s (ENB) C$19BN acquisition of three utilities from Dominion last year wasn’t well received. They’ve raised 85% of the funds needed through debt, equity and asset sales. ENB stock is -4% over the past year, meaningfully underperforming the sector. Their 7.8% yield is 1.4X covered by DCF. Analyst opinion is mixed – JPMorgan is Overweight while Wells Fargo is Underweight.
TC Energy (TRP) has also lagged the sector, +4% over the past year. Their capex has been higher than investors would like over the past couple of years, but projects are nearing completion and spending is coming down. Coastal GasLink was completed late last year and will provide natural gas to LNG Canada’s export terminal in Kitimat, BC for export to Asian customers. The Southeast Gateway project will connect customers in Mexico with domestic supply. It is scheduled to be completed next year. This year capex is forecast to be C$8-8.5 and closer to C$6BN next year. Their 7% dividend yield is 1.5X covered by DCF.
Overall earnings confirmed the predictability of cashflows in the midstream sector. It is often described as a “toll-like” business model. The pandemic-induced collapse in 2020 challenged this description, but performance since then has shown that the description remains apt. Attractive dividends with ample coverage from DCF is common across the sector.

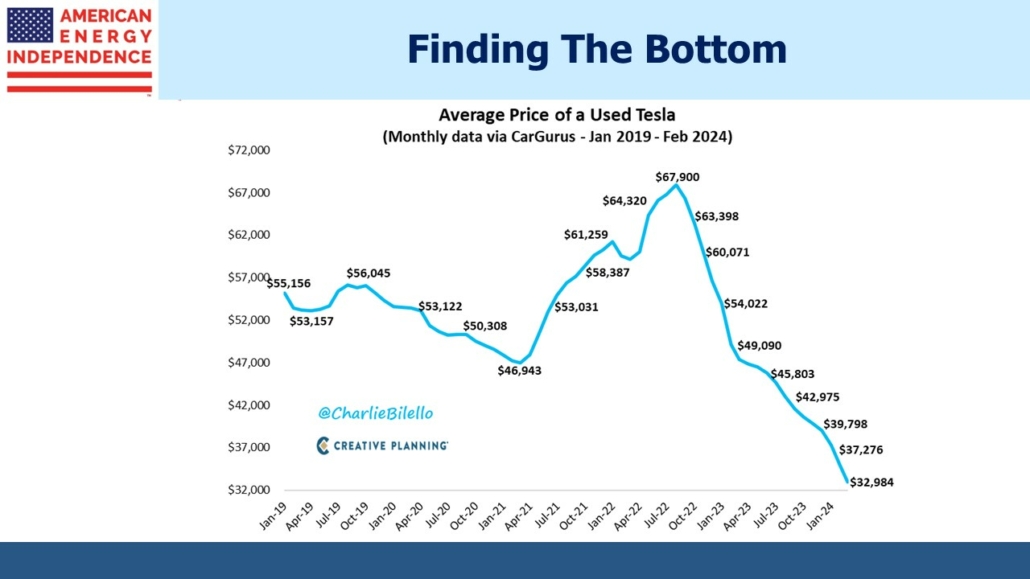
I was struck by a chart the other day showing a sharp drop in the price of used Teslas. A couple of years ago wait times of as much as a year were common for buyers to take delivery of their new vehicle. Nowadays it’s a few weeks, and sales have slowed so that Electric Vehicles (EVs) are taking dealers longer to shift than conventional cars.
The halving of resale values for EVs reflects consumer realization that they’re nice to drive but charging is inconvenient. Cold weather reduces their battery range, as does age. As suggested in this video (see Stop Paying For Overpriced EVs), these are the reasons they ought to be cheaper than an equivalent gas-powered car. Reduced resale value boosts annual depreciation, increasing the cost of ownership.
EVs are gradually finding a more appropriate price point.

—
Originally Posted February 28, 2024 – 4Q Earnings Wrap
Important Disclosures
The information provided is for informational purposes only and investors should determine for themselves whether a particular service, security or product is suitable for their investment needs. The information contained herein is not complete, may not be current, is subject to change, and is subject to, and qualified in its entirety by, the more complete disclosures, risk factors and other terms that are contained in the disclosure, prospectus, and offering. Certain information herein has been obtained from third party sources and, although believed to be reliable, has not been independently verified and its accuracy or completeness cannot be guaranteed. No representation is made with respect to the accuracy, completeness or timeliness of this information. Nothing provided on this site constitutes tax advice. Individuals should seek the advice of their own tax advisor for specific information regarding tax consequences of investments. Investments in securities entail risk and are not suitable for all investors. This site is not a recommendation nor an offer to sell (or solicitation of an offer to buy) securities in the United States or in any other jurisdiction.
References to indexes and benchmarks are hypothetical illustrations of aggregate returns and do not reflect the performance of any actual investment. Investors cannot invest in an index and do not reflect the deduction of the advisor’s fees or other trading expenses. There can be no assurance that current investments will be profitable. Actual realized returns will depend on, among other factors, the value of assets and market conditions at the time of disposition, any related transaction costs, and the timing of the purchase. Indexes and benchmarks may not directly correlate or only partially relate to portfolios managed by SL Advisors as they have different underlying investments and may use different strategies or have different objectives than portfolios managed by SL Advisors (e.g. The Alerian index is a group MLP securities in the oil and gas industries. Portfolios may not include the same investments that are included in the Alerian Index. The S & P Index does not directly relate to investment strategies managed by SL Advisers.)
This site may contain forward-looking statements relating to the objectives, opportunities, and the future performance of the U.S. market generally. Forward-looking statements may be identified by the use of such words as; “believe,” “expect,” “anticipate,” “should,” “planned,” “estimated,” “potential” and other similar terms. Examples of forward-looking statements include, but are not limited to, estimates with respect to financial condition, results of operations, and success or lack of success of any particular investment strategy. All are subject to various factors, including, but not limited to general and local economic conditions, changing levels of competition within certain industries and markets, changes in interest rates, changes in legislation or regulation, and other economic, competitive, governmental, regulatory and technological factors affecting a portfolio’s operations that could cause actual results to differ materially from projected results. Such statements are forward-looking in nature and involves a number of known and unknown risks, uncertainties and other factors, and accordingly, actual results may differ materially from those reflected or contemplated in such forward-looking statements. Prospective investors are cautioned not to place undue reliance on any forward-looking statements or examples. None of SL Advisors LLC or any of its affiliates or principals nor any other individual or entity assumes any obligation to update any forward-looking statements as a result of new information, subsequent events or any other circumstances. All statements made herein speak only as of the date that they were made. r
Certain hyperlinks or referenced websites on the Site, if any, are for your convenience and forward you to third parties’ websites, which generally are recognized by their top level domain name. Any descriptions of, references to, or links to other products, publications or services does not constitute an endorsement, authorization, sponsorship by or affiliation with SL Advisors LLC with respect to any linked site or its sponsor, unless expressly stated by SL Advisors LLC. Any such information, products or sites have not necessarily been reviewed by SL Advisors LLC and are provided or maintained by third parties over whom SL Advisors LLC exercise no control. SL Advisors LLC expressly disclaim any responsibility for the content, the accuracy of the information, and/or quality of products or services provided by or advertised on these third-party sites.
All investment strategies have the potential for profit or loss. Different types of investments involve varying degrees of risk, and there can be no assurance that any specific investment will be suitable or profitable for a client’s investment portfolio.
Past performance of the American Energy Independence Index is not indicative of future returns.
Disclosure: SL Advisors
Please go to following link for important legal disclosures: http://sl-advisors.com/legal-disclosure
SL Advisors is invested in all the components of the American Energy Independence Index via the ETF that seeks to track its performance.
Disclosure: Interactive Brokers
Information posted on IBKR Campus that is provided by third-parties does NOT constitute a recommendation that you should contract for the services of that third party. Third-party participants who contribute to IBKR Campus are independent of Interactive Brokers and Interactive Brokers does not make any representations or warranties concerning the services offered, their past or future performance, or the accuracy of the information provided by the third party. Past performance is no guarantee of future results.
This material is from SL Advisors and is being posted with its permission. The views expressed in this material are solely those of the author and/or SL Advisors and Interactive Brokers is not endorsing or recommending any investment or trading discussed in the material. This material is not and should not be construed as an offer to buy or sell any security. It should not be construed as research or investment advice or a recommendation to buy, sell or hold any security or commodity. This material does not and is not intended to take into account the particular financial conditions, investment objectives or requirements of individual customers. Before acting on this material, you should consider whether it is suitable for your particular circumstances and, as necessary, seek professional advice.

