Investopedia is partnering with CMT Association on this newsletter. The contents of this newsletter are for informational and educational purposes only, however, and do not constitute investing advice. The guest authors, which may sell research to investors, and may trade or hold positions in securities mentioned herein do not represent the views of CMT Association or Investopedia. Please consult a financial advisor for investment recommendations and services.
1/ Finance Breaks Higher
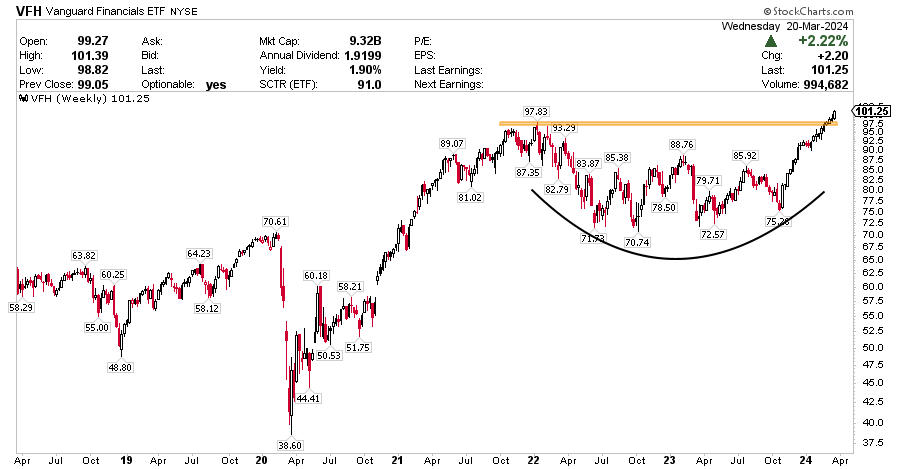
The finance sector is having a very good 2024. It is second only to Industrials, Technology and Energy.
The fund VFH tracks a market cap-weighted index of companies in the US financials sector. During the last quarter the ETF has grown by about 30%.
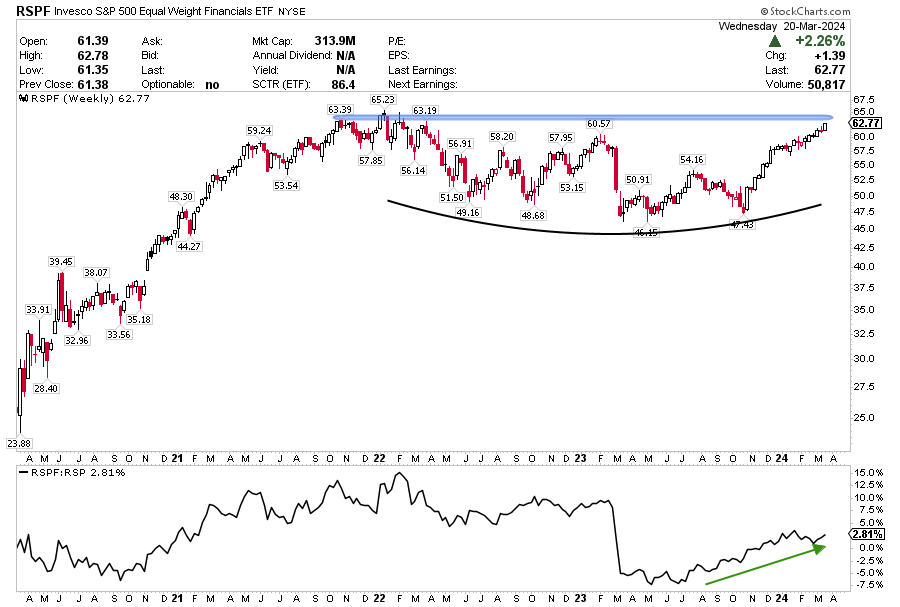
The equal weight ETF is not breaking higher yet, but it remains really close to the resistance and the relative strength ratio (below) has turned positive and is continuously moving higher. We probably will witness a breakout in the short term.
2/ Wells Fargo & Co.
Wells Fargo also breaks up and follows in the footsteps of Citigroup and J.P. Morgan Chase.
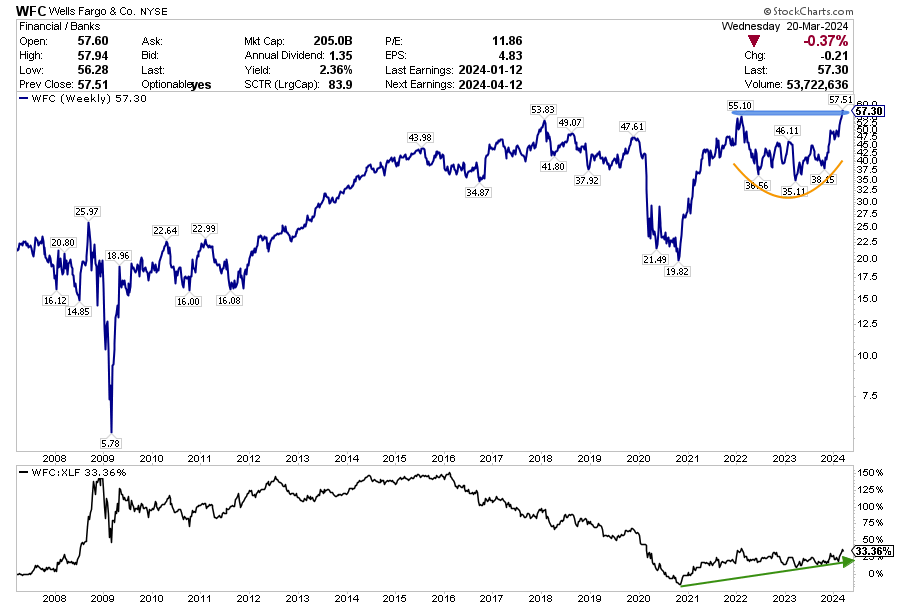
The price finally breaks the 55 resistance level to the upside, after remaining below this level for about two years. Since the end of 2014, the price has oscillated between 30 and 50 with the exception of the COVID period when the price fell to the 20 level.
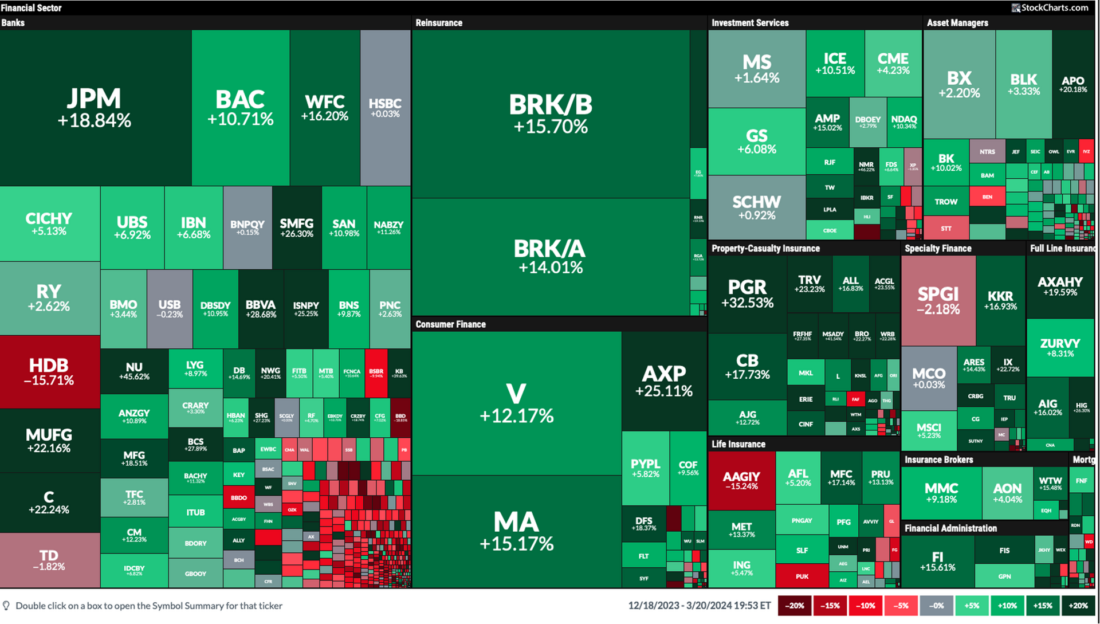
Citigroup and J.P. Morgan are already breaking their bases. Will this be the next one?
3/ Stocks Party On
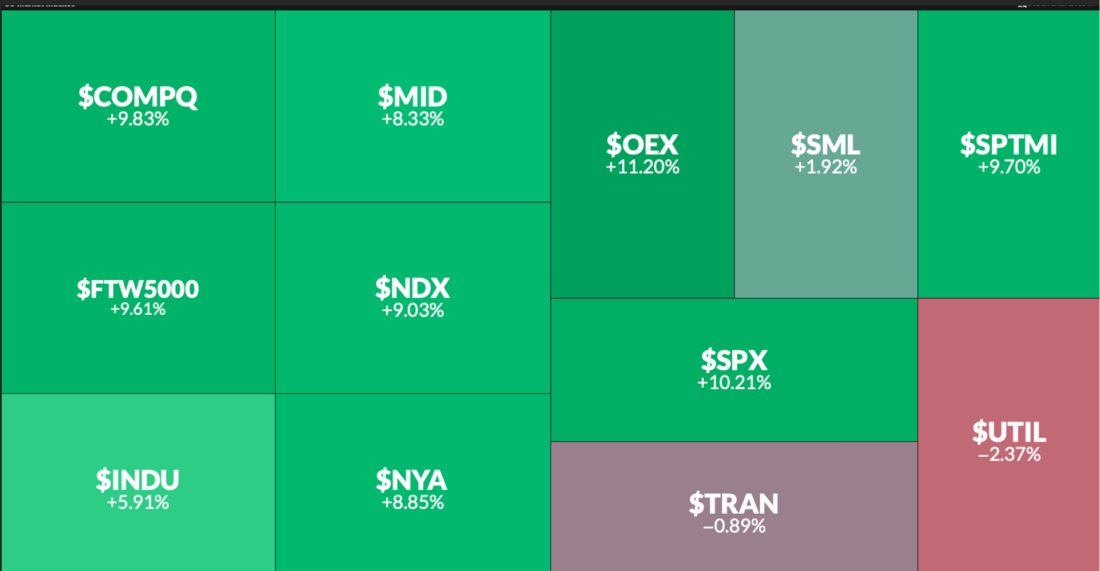
The Dow Jones Industrial Average, S&P 500, and the Nasdaq Composite marked record closes Wednesday for the first time since 2021.
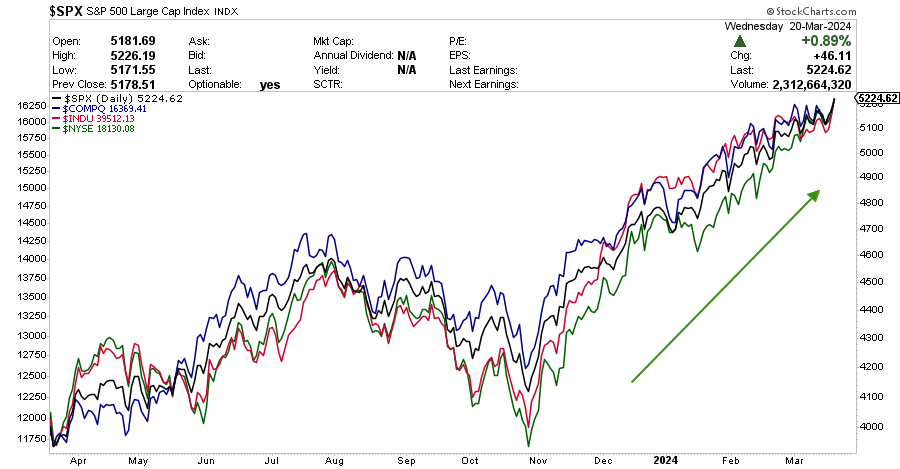
After the Federal Reserve kept interest rates steady and projected three cuts this year, the three major indexes headed toward fresh records. At least for today, concerns that firmer-than-expected inflation could cause the central bank to reduce the likely number of rate cuts in 2024 appear to have dissipated. The Fed has confirmed that the economy is strong enough that it will not have to cut rates.
4/ DR Horton Inc.
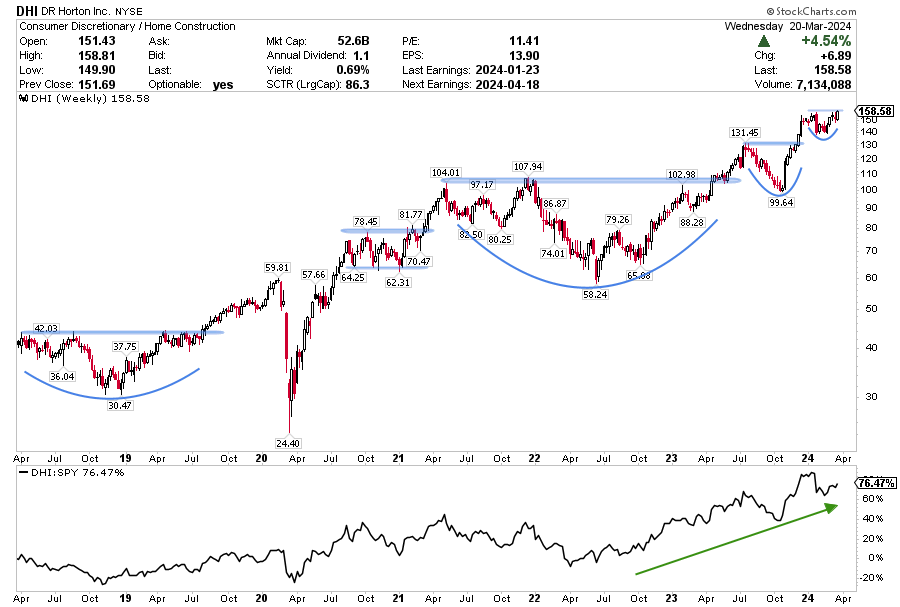
D.R. Horton Inc. hit a new 52-week high, surpassing its previous peak of $157.60, which the company reached on January 22nd.
Price continues to break bases and move higher from 2019. The relative strength ratio depicts a solid uptrend that could extend a bit further. The Homebuilding sector remains strong, so we could see the bullish rally continue.
—
Originally posted on March 21st 2024
Disclosure: Investopedia
Investopedia.com: The comments, opinions and analyses expressed herein are for informational purposes only and should not be considered individual investment advice or recommendations to invest in any security or to adopt any investment strategy. While we believe the information provided herein is reliable, we do not warrant its accuracy or completeness. The views and strategies described on our content may not be suitable for all investors. Because market and economic conditions are subject to rapid change, all comments, opinions and analyses contained within our content are rendered as of the date of the posting and may change without notice. The material is not intended as a complete analysis of every material fact regarding any country, region, market, industry, investment or strategy. This information is intended for US residents only.
Disclosure: Interactive Brokers
Information posted on IBKR Campus that is provided by third-parties does NOT constitute a recommendation that you should contract for the services of that third party. Third-party participants who contribute to IBKR Campus are independent of Interactive Brokers and Interactive Brokers does not make any representations or warranties concerning the services offered, their past or future performance, or the accuracy of the information provided by the third party. Past performance is no guarantee of future results.
This material is from Investopedia and is being posted with its permission. The views expressed in this material are solely those of the author and/or Investopedia and Interactive Brokers is not endorsing or recommending any investment or trading discussed in the material. This material is not and should not be construed as an offer to buy or sell any security. It should not be construed as research or investment advice or a recommendation to buy, sell or hold any security or commodity. This material does not and is not intended to take into account the particular financial conditions, investment objectives or requirements of individual customers. Before acting on this material, you should consider whether it is suitable for your particular circumstances and, as necessary, seek professional advice.
Disclosure: ETFs
Any discussion or mention of an ETF is not to be construed as recommendation, promotion or solicitation. All investors should review and consider associated investment risks, charges and expenses of the investment company or fund prior to investing. Before acting on this material, you should consider whether it is suitable for your particular circumstances and, as necessary, seek professional advice.

