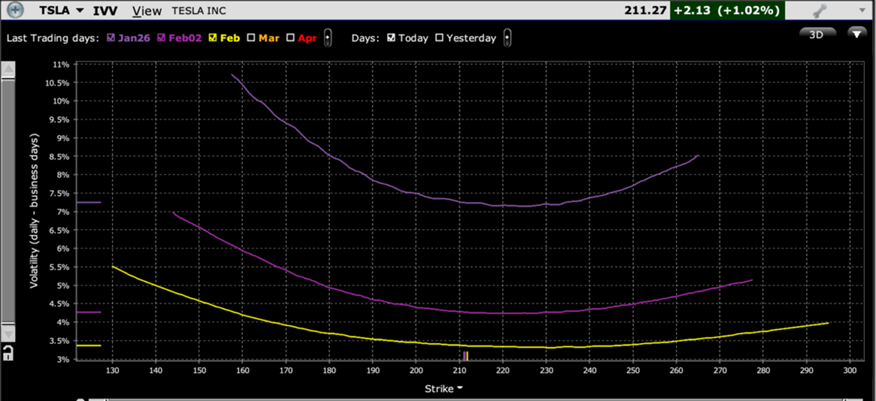
The least magnificent of the “Magnificent Seven” so far this year reports after today’s close. We are of course referring to Tesla (TSLA), which was down over 40% from the end of last year through yesterday.
TSLA has perpetually occupied a leading position in investors’ mindsets. It is continually among the most active stocks and options amidst our customers’ activity and in the market overall. Much of that has to do with the company’s lightning rod founder and leader, Elon Musk. Love him or hate him – and there are many with fervent views on either side of that divide – he is impossible to ignore. That is why, even after a run of negative corporate news, including significant layoffs and another round of price cuts, investors are likely to be even more focused upon Musk’s conference call than they are on the usual corporate metrics.
That said, the metrics still matter. Consensus estimates are for adjusted EPS of $0.52 (unadjusted $0.41) on revenues of $22.3 billion. Free cash flow is estimated at $651.7 million, and automotive gross margins are anticipated to be 17.6% for the past quarter and 17.9% for next quarter and the rest of the year. Significant deviation from any of these figures could certainly cause an initial after-market reaction in either direction, though I believe that more will be riding on unknowable items like Musk’s demeanor and ancillary comments.
I really dislike falling into the “this is the most crucial earnings report since…” type of thinking, but considering TSLA’s recent performance and the number of commentators who are already weighing in on the likely outcome, this is indeed an important event. Bearing in mind that we advocated for TSLA’s ouster from the Magnificent Seven ahead of January’s earnings report, I now have a nagging contrarian belief that a significant amount of bad news may already be priced into the stock, even if there is a precarious lack of support down to the $100 level. Let’s see what the options market thinks.
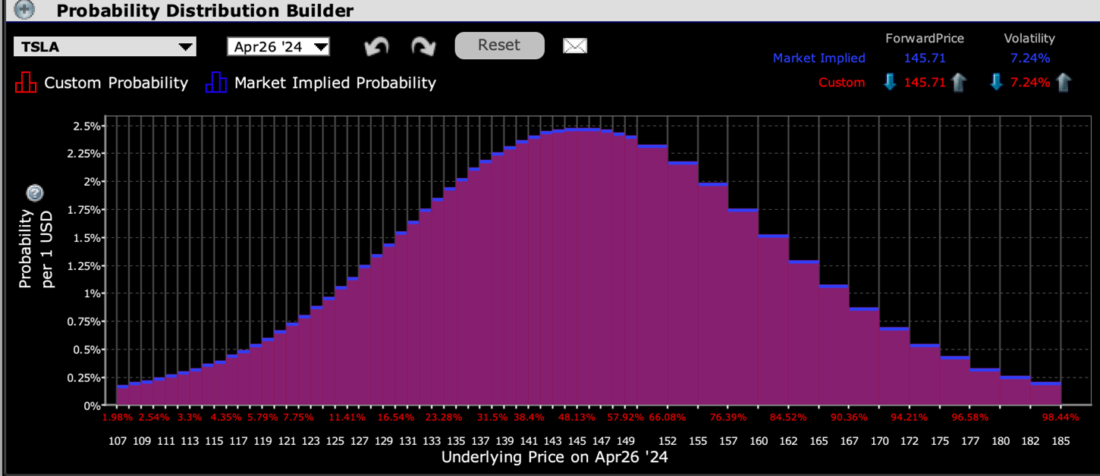
The IBKR Probability Lab shows a rather balanced view among options expiring on Friday. The curve is essentially symmetrical with at- and near-money strikes showing peak likelihood:
IBKR Probability Lab for TSLA Options Expiring April 26th, 2024

Source: Interactive Brokers
Meanwhile, we see that weekly, at-money options are pricing in a daily average volatility of about 8%. Considering the focus on today’s report and TSLA’s propensity for post-earnings volatility – the stock has moved +10.97%, -9.75%, -9.74%, -9.30%, and -12.13% on the days following each of the past five releases – one might assert that the current volatility expectation is a bit light:
TSLA Term Structure of Volatility

Source: Interactive Brokers
Nonetheless, options traders are pricing in significantly more volatility today than they were before last quarters’ report:
TSLA Term Structure of Volatility, Today (right), Jan 23rd, 2024 (left)

Source: Interactive Brokers
Along with the heightened implied volatility levels, the skew curve shows a relatively normal amount of risk aversion. Note the steepness of the downside skew for options expiring this week:
TSLA Implied Volatilities by Strike, Options Expiring April 26th (top), May 17th (middle), June 21st (bottom)

Source: Interactive Brokers
Contrast today’s readings with those from the day of TSLA’s last report. Notice how those skews were flatter and more symmetrical ahead of a double-digit percentage drop: The
TSLA Implied Volatilities by Strike, Options Expiring January 26th (top), February 2nd (middle), February 16th (bottom)

Source: Interactive Brokers
The contrast between the relatively sanguine view that the options market held last quarter and the more normal view held today are what leads me to the potential for a contrarian bounce today. I don’t believe that is the base case and would feel far more confident in that view if the options market showed true nervousness and the stock’s technical picture was less dire. The psychology surrounding TSLA has become increasingly gloomy, something unfamiliar to the long-time faithful. It will be up to TSLA’s chief executive and chief evangelist to restore positive sentiment to his investors. We’ll see later if he can deliver.
Disclosure: Interactive Brokers
The analysis in this material is provided for information only and is not and should not be construed as an offer to sell or the solicitation of an offer to buy any security. To the extent that this material discusses general market activity, industry or sector trends or other broad-based economic or political conditions, it should not be construed as research or investment advice. To the extent that it includes references to specific securities, commodities, currencies, or other instruments, those references do not constitute a recommendation by IBKR to buy, sell or hold such investments. This material does not and is not intended to take into account the particular financial conditions, investment objectives or requirements of individual customers. Before acting on this material, you should consider whether it is suitable for your particular circumstances and, as necessary, seek professional advice.
The views and opinions expressed herein are those of the author and do not necessarily reflect the views of Interactive Brokers, its affiliates, or its employees.
Disclosure: Options Trading
Options involve risk and are not suitable for all investors. Multiple leg strategies, including spreads, will incur multiple commission charges. For more information read the “Characteristics and Risks of Standardized Options” also known as the options disclosure document (ODD) or visit ibkr.com/occ

