After a much-better-than-expected 2023, the outlook going into 2024 remains favorable, but slightly less so than this time a year ago, and for somewhat different reasons.
As 2023 winds down, we see that for US investors at least, the economy (growth and inflation), corporate earnings, and the stock market did far better than most investors, economists, and even central bankers expected at the start of the year.
Stock prices tend to do well when results come in better than expected, so low expectations are often a favorable backdrop for future gains. The bearishness on the economy was high at this time last year, as I recall from the questions I got from clients and the media, along the lines of: “Everyone knows we’re going into recession in 2023, just how bad do you think it will be?”. To the surprise of many of the folks I talked to, I was not bearish and did not think we were going into recession then, and don’t see one coming imminently now. The Fed’s aggressive monetary tightening plans were certainly a concern back then but the bear market in 2022 seemed to have priced much of the bad news in.
So back in January, I was looking at the Global Equity Risk Model we have long used for 1-6 month asset allocation guidance and it was at bullish readings (where it has stayed for much of this year). And the earnings estimate data I track was showing leadership in Technology and improvement in cyclical sectors like Consumer Discretionary and Industrials, which is not what you would expect to see on the precipice of a recession.
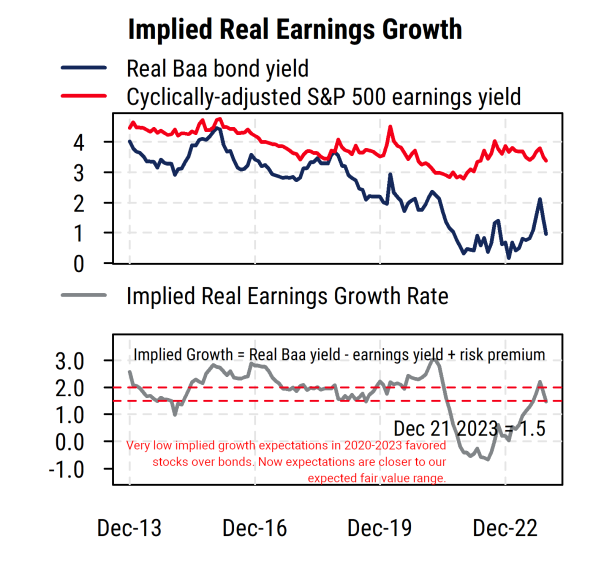
We have also long used our Implied Growth Model to estimate the level of long-run real earnings growth expectations built into US stock prices (i.e., “what growth is implied by current market prices?”), based on cyclically-adjusted earnings, bond yields, stock prices, inflation, and a risk premium based on the economic backdrop. Without delving into the details of the calculations, the message is that growth expectations were extremely low for much of the 2020-2023 period, including at the start of this year, which led us (correctly) to favor stocks over bonds on a relative valuation basis as things turned out better than the very negative expectations.
What about now?
Expectations are certainly higher now than they were at this time a year ago, meaning it may be harder for economic data and earnings to continue to beat expectations by such a wide margin. That does not mean stocks have to fall significantly, just that the gains may be choppier as investors are now expecting moderate growth and may get it.
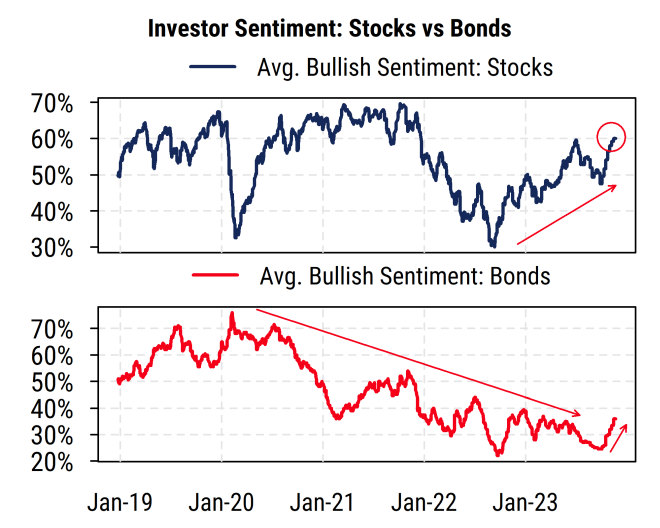
Sentiment surveys of stock investors show much higher levels of bullishness now, though broadly speaking not at historically extreme levels, as shown in the chart below. The indicators average several investor sentiment surveys together to get composite sentiment readings on US stocks and bonds. We also see that investors remain bearish on bonds (unsurprising after the worst multi-year bond market returns in decades) but that has shifted notably recently after the Fed’s “pivot” toward potential rate cuts in 2024.

Source: Mill Street Research, Consensus Inc., Market Vane, Investors Intelligence
What does our Implied Growth model reading say now? After a long period of low and sometimes negative readings, it has returned to our expected “fair value” range of 1.5-2.0% (a conservative estimate of where we think long-run real growth will be). This indicates that market implied long-run real growth expectations are not excessive but no longer unusually low, pointing to a somewhat more balanced allocation between equities and fixed income.

Source: Mill Street Research, Factset, Bloomberg
Economic view going into 2024
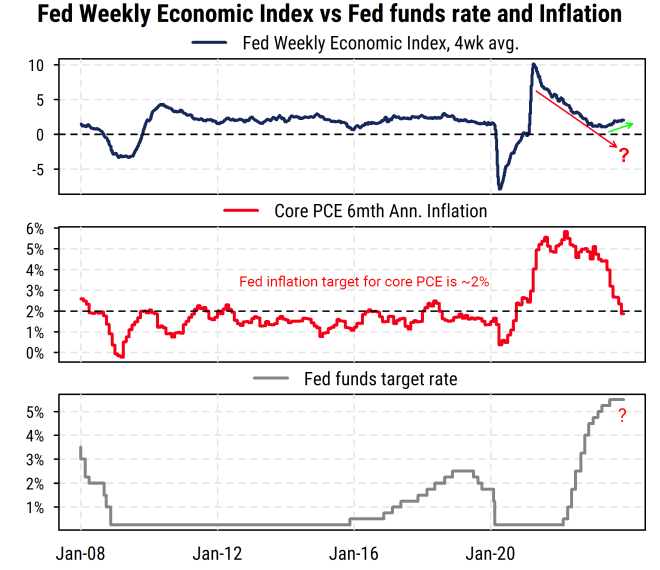
The good news is that the US economy is holding up much better than expected, currently showing a 2-2.5% real growth rate, and inflation is coming down rapidly as supply chains have healed, more people are employed, and fiscal policy is very supportive. That is, a “soft landing” appears to be happening, potentially similar to the 1995-97 period. This contrasts with the widespread assumption at the start of the year that the economy would continue to decelerate after the COVID-related stimulus ended and fall into recession due to the Fed’s aggressive tightening. And the assumption was that the only way to get inflation to go down was for higher rates to crush demand and raise unemployment.
As it turns out, most of those projections and assumptions were wrong. Inflation was primarily caused by supply shocks, and once the shocks eased and supply chains got better, inflation came down on its own. Higher rates may have helped somewhat, and rates did not need to remain at zero, but monetary policy had far less impact on inflation or growth than most people assume.
I have been highlighting for some time the importance of US fiscal policy in helping to produce this favorable economic outcome. In particular, the investment-oriented fiscal programs put in place in late 2021 and 2022 (after the COVID-related stimulus had ended) have been critical in both keeping current spending and employment up and in creating additional productive capacity that should help keep inflation down over the longer-term. These include the Infrastructure Investment & Jobs Act (signed Nov. 2021), the CHIPS and Science Act (Aug 2022) and Inflation Reduction Act (Aug 2022). The effects of those programs are likely to continue to be felt in the economy in 2024 (barring dramatic action by Congress) though they may be more priced into equities now.

Source: Mill Street Research, Factset, Bloomberg
Inflation is already essentially back to the Fed’s target of around 2% (the 6-month annualized rate is now, and the traditional 12-month rate will almost certainly be soon), and this is even more clearly visible after accounting for the impact of lagged housing/rent costs in the CPI/PCE inflation data. This is why the Fed has indicated that rate cuts are likely in 2024, as a 5.5% short-term interest rate is very high in an environment of roughly 2% inflation, and would represent excessively tight monetary policy. Stocks and bonds have gone a long way toward pricing in this good news already, but changing the Fed from a headwind to a tailwind and investors having the 1995-97 soft landing episode in mind should help stocks hold up and potentially gain further in 2024.
The risk in 2024 and beyond is (once again) going to be too little growth rather than too much. This is particularly true outside the US (Europe, China, etc.).
The hope is that we avoid any new major shocks (pandemics, wars, OPEC, etc.) and the US can achieve ~2% real growth with low inflation, with help from the better fiscal policy. The political risk is that Congress focuses excessively (and erroneously) on deficit reduction and cuts spending too aggressively, yanking a key support from the economy.
Momentum going into early 2024 is supportive, but big upside surprises may be harder to come by
Our Global Equity Risk Model is back to bullish readings thanks to the favorable trends in equities and credit, and monetary policy looks to be less of a headwind in 2024. So we continue to favor stocks over bonds (just somewhat less so than a year ago), favor US over non-US stocks, favor Technology and Financials among sectors, underweight commodities, and still favor large-caps over small-caps for now.
—
Originally Posted December 23, 2023 – 2024 Outlook
Disclosure: Mill Street Research
Source for data and statistics: Mill Street Research, FactSet, Bloomberg
This report is not intended to provide investment advice. This report does not constitute an offer or solicitation to buy or sell any securities discussed herein in any jurisdiction where such offer or solicitation would be prohibited. Past performance is not a guarantee of future results, and no representation or warranty, express or implied, is made regarding future performance of any security mentioned in this report.
All information, opinions and statistical data contained in this report were obtained or derived from public sources believed to be reliable, but Mill Street does not represent that any such information, opinion or statistical data is accurate or complete. All estimates, opinions and recommendations expressed herein constitute judgments as of the date of this report and are subject to change without notice.
Disclosure: Interactive Brokers
Information posted on IBKR Campus that is provided by third-parties does NOT constitute a recommendation that you should contract for the services of that third party. Third-party participants who contribute to IBKR Campus are independent of Interactive Brokers and Interactive Brokers does not make any representations or warranties concerning the services offered, their past or future performance, or the accuracy of the information provided by the third party. Past performance is no guarantee of future results.
This material is from Mill Street Research and is being posted with its permission. The views expressed in this material are solely those of the author and/or Mill Street Research and Interactive Brokers is not endorsing or recommending any investment or trading discussed in the material. This material is not and should not be construed as an offer to buy or sell any security. It should not be construed as research or investment advice or a recommendation to buy, sell or hold any security or commodity. This material does not and is not intended to take into account the particular financial conditions, investment objectives or requirements of individual customers. Before acting on this material, you should consider whether it is suitable for your particular circumstances and, as necessary, seek professional advice.

