By Kapil Mokashi, CMT, CFP
1/ Gold Boosted by a Softening US Dollar
2/ Navigating the Crude Oil Squeeze: Anticipating the Next Big Move
3/ Jackson Hole: Fed Insights & Market Impact
Investopedia is partnering with CMT Association on this newsletter. The contents of this newsletter are for informational and educational purposes only, however, and do not constitute investing advice. The guest authors, which may sell research to investors, and may trade or hold positions in securities mentioned herein do not represent the views of CMT Association or Investopedia. Please consult a financial advisor for investment recommendations and services.
1/ Gold Boosted by a Softening US Dollar
The recent weakness in the US dollar has played a significant role in lifting gold prices. Despite stronger-than-expected data on US retail sales, jobless claims, and consumer sentiment last week, the dollar lost ground due to lower inflation readings and weaker industrial production and housing figures. The Federal Reserve’s focus appears to be shifting more toward employment, with the rising unemployment rate, now at 4.3%, surpassing its year-end projection. This shift has contributed to the dollar’s struggle to maintain its strength, as currency traders increasingly focus on employment data.
On the technical front, the Dollar Index continues to show signs of vulnerability. It is trading below its 200-day Exponential Moving Average (DEMA) and has recently experienced a breakdown from a symmetrical triangle pattern on the weekly chart, signalling potential for further downside. The pattern of lower highs and lower lows across daily and weekly timeframes indicates that the dollar is likely to face continued selling pressure on any rallies.
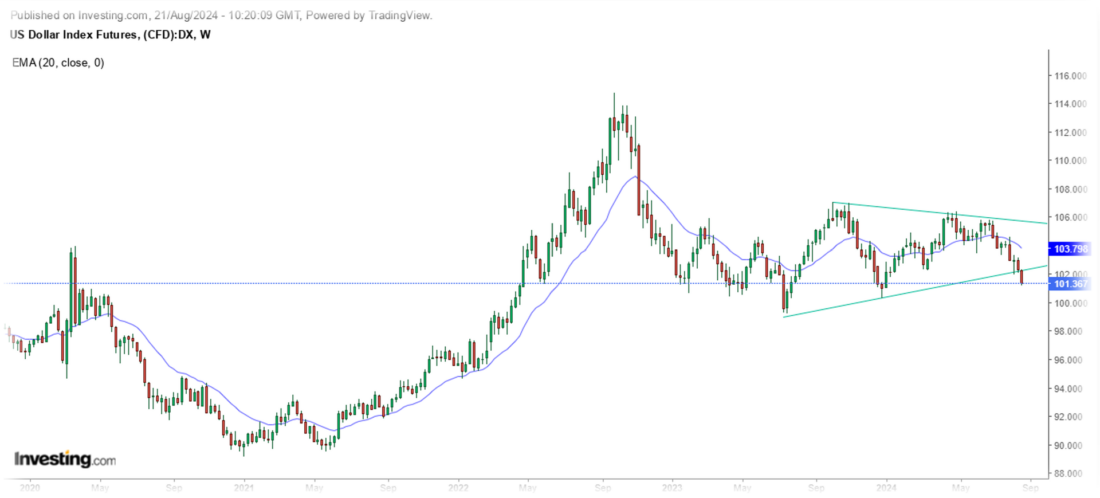
Looking ahead, market expectations are leaning towards the Fed reducing interest rates by around 100 basis points by the end of the year, with a 25-basis point cut anticipated in September instead of the previously expected 50 basis points. As the upcoming symposium provides a clear indications of a September rate cut, this could further weaken the dollar, offering additional support for gold.
2/ Navigating the Crude Oil Squeeze: Anticipating the Next Big Move
A Bollinger Band Squeeze occurs when the Bollinger Bands contract due to reduced market volatility, often signalling an impending significant price movement. As John Bollinger noted, periods of low volatility typically precede heightened volatility. When the bands narrow, it suggests a potential breakout, with an upward trend indicated by a break above the upper band, and a downward trend signaled by a break below the lower band.
Currently, Crude Oil, one of the most widely traded commodities, is exhibiting a similar squeeze. This is particularly relevant because Crude Oil’s price movements can create ripple effects across other asset classes. For illustration, we are using daily prices with Bollinger Bands set at 20 periods and two standard deviations. These bands are constructed around the 20-day Simple Moving Average (SMA), with the upper and lower bands positioned two standard deviations above and below the SMA. The Bollinger Band Squeeze is a straightforward strategy. First, identify securities with narrowing Bollinger Bands. Then, wait for a band break to signal the start of a new move—an upside break is bullish, while a downside break is bearish. However, narrowing bands don’t indicate direction, only that volatility is contracting. Traders often combine the BB squeeze with other technical tools for better trading opportunities.
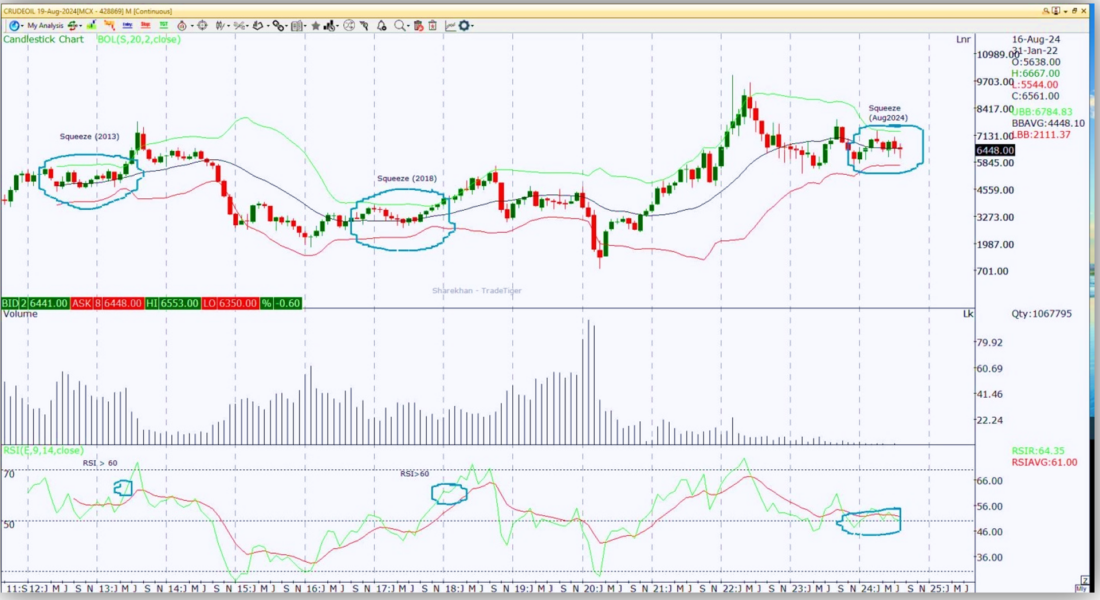
Observing Crude Oil’s monthly chart, since January 2024, it has been trading within a narrow range, forming a squeeze. Similar patterns in June 2013 and January 2018 led to rallies of 30-35% post-breakout. Currently, RSI levels near 50 suggest indecision. A break below the lower band, combined with RSI below 40 and increased volume, would indicate bearish momentum. Conversely, an upside break would suggest a bullish trend. The pattern of lower highs on the monthly chart hints at a potential downside break, but we advise waiting for confirmation before taking action.
Regardless of the outcome, Crude Oil’s movements in the coming period could have significant implications for global asset classes.
3/ Jackson Hole: Fed Insights & Market Impact
Courtesy of barchart
Federal Reserve Chair Jerome Powell’s speech at the Kansas City Fed’s economic symposium highlighted several key points:
- Interest Rate Cuts Expected: Powell indicated that an interest-rate cut is likely at the Fed’s next meeting in September, as the time has come for policy adjustments. However, the timing and pace of these cuts will be dependent on incoming economic data.
- Labour Market Cooling: Powell acknowledged a noticeable cooling in the labour market but emphasized that the Fed does not aim for further weakening in labour conditions.
- Inflation Outlook: He expressed increased confidence that inflation is on a sustainable path back to the Fed’s 2% target, noting that the upside risks to inflation have diminished.
- Balancing Risks: Powell discussed the growing downside risks to employment while maintaining optimism that the Fed can achieve its inflation goal without significantly harming the labour market.
- Policy Flexibility: The speech reflected on the Fed’s response to recent inflationary pressures, admitting the initial mistake of labeling rising prices as transitory and stressing the importance of applying lessons learned to current and future challenges.
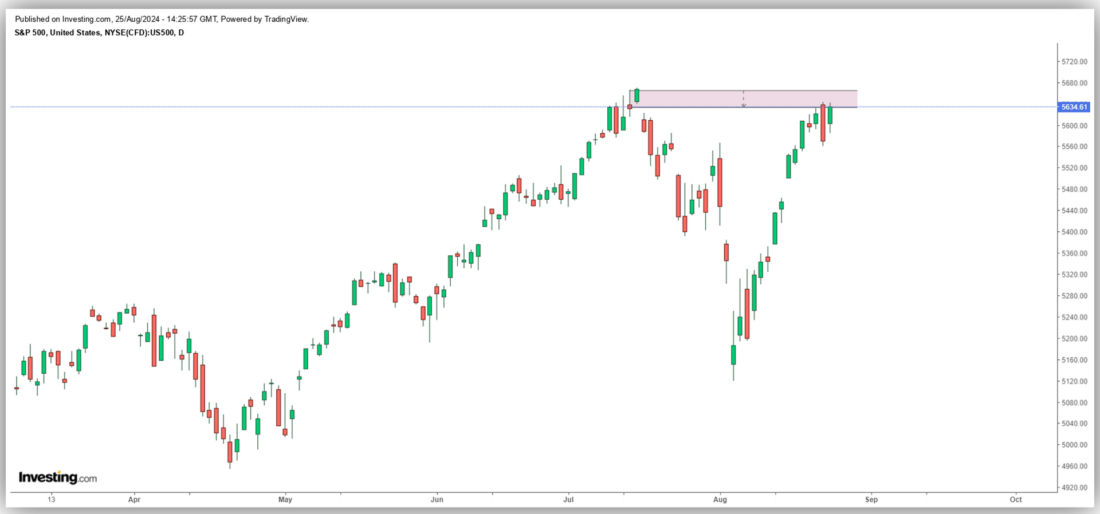
- The financial markets are likely to react positively in the upcoming week to Jerome Powell’s speech, as it solidifies expectations for an interest rate cut at the Fed’s September meeting. This anticipated rate cut could provide a boost to equities, particularly in interest-sensitive sectors like technology and real estate. Bond markets might see a rally, with yields potentially declining as investor’s price in a more accommodative monetary policy. However, the only concern is, since most of this is already factored in, there is a chance that the initial rally may fizzle out as we approach the critical resistance levels on the S&P 500 as seen on the charts. Traders should approach the markets cautiously & not get carried away by the euphoria surrounding the rate cuts. Let’s not forget that the very nature of markets is that they discount everything in advance!
About This Week’s Author
Kapil Mokashi, CMT, CFP is currently associated with Sharekhan Education, one of the larges brokers in India, as a Head of Education products. He has been in Financial Markets for the past 15 years with a wide exposure to different asset classes such as Mutual Funds, Insurance, Fixed Income, Equities, Derivatives, and Currencies & Commodities Markets. He can generate research opinions, portfolio strategies or trading decisions based on a wide range of charts and technical data. Kapil is a passionate writer with many educational articles written in financial newspapers magazines, websites to enable investors and traders to take better investment and trading decisions.
—————————————————
Originally posted on August 26, 2024
Disclosure: Investopedia
Investopedia.com: The comments, opinions and analyses expressed herein are for informational purposes only and should not be considered individual investment advice or recommendations to invest in any security or to adopt any investment strategy. While we believe the information provided herein is reliable, we do not warrant its accuracy or completeness. The views and strategies described on our content may not be suitable for all investors. Because market and economic conditions are subject to rapid change, all comments, opinions and analyses contained within our content are rendered as of the date of the posting and may change without notice. The material is not intended as a complete analysis of every material fact regarding any country, region, market, industry, investment or strategy. This information is intended for US residents only.
Disclosure: Interactive Brokers
Information posted on IBKR Campus that is provided by third-parties does NOT constitute a recommendation that you should contract for the services of that third party. Third-party participants who contribute to IBKR Campus are independent of Interactive Brokers and Interactive Brokers does not make any representations or warranties concerning the services offered, their past or future performance, or the accuracy of the information provided by the third party. Past performance is no guarantee of future results.
This material is from Investopedia and is being posted with its permission. The views expressed in this material are solely those of the author and/or Investopedia and Interactive Brokers is not endorsing or recommending any investment or trading discussed in the material. This material is not and should not be construed as an offer to buy or sell any security. It should not be construed as research or investment advice or a recommendation to buy, sell or hold any security or commodity. This material does not and is not intended to take into account the particular financial conditions, investment objectives or requirements of individual customers. Before acting on this material, you should consider whether it is suitable for your particular circumstances and, as necessary, seek professional advice.
Disclosure: Forex
There is a substantial risk of loss in foreign exchange trading. The settlement date of foreign exchange trades can vary due to time zone differences and bank holidays. When trading across foreign exchange markets, this may necessitate borrowing funds to settle foreign exchange trades. The interest rate on borrowed funds must be considered when computing the cost of trades across multiple markets.
Disclosure: Futures Trading
Futures are not suitable for all investors. The amount you may lose may be greater than your initial investment. Before trading futures, please read the CFTC Risk Disclosure. A copy and additional information are available at ibkr.com.
