There are plenty of reasons to be cautious here. For starters, in the next fifteen days we get the August Jobs Report, CPI and PPI data, and an “in-play” FOMC meeting. And with equity markets trading sharply lower this morning, we are certainly off to an auspicious start for September. Yet while many are concerned about seasonality – and yes, we’ve noted that each of the past four Septembers have seen the S&P 500 (SPX) trade lower – remember that it can be a nebulous concept.
Seasonality seems ominous when we consider the following data:
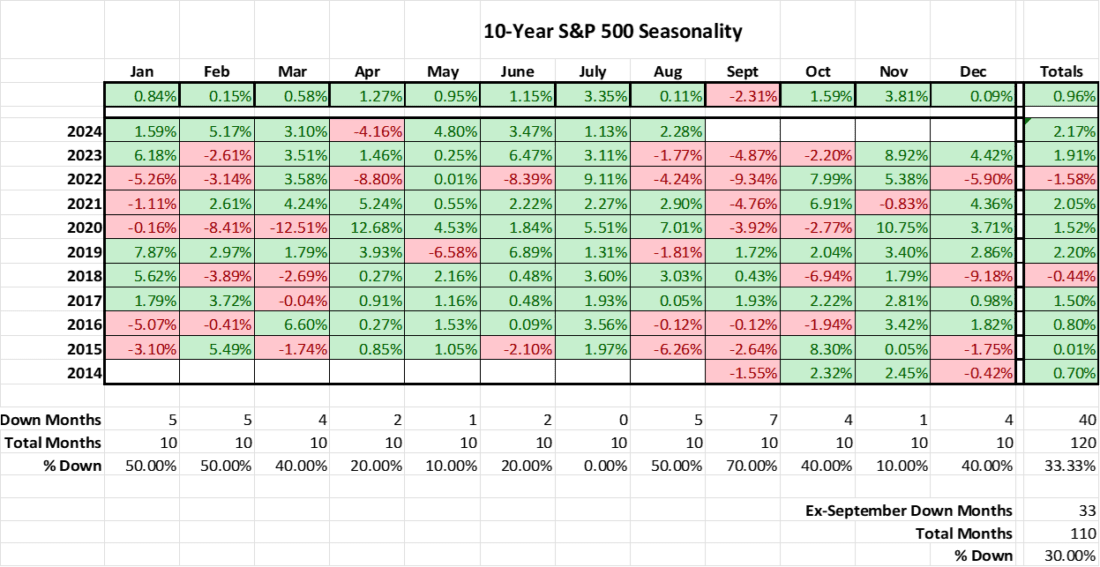
Source: Interactive Brokers
The recent track record bodes poorly for investors. Over the past ten years, September has been the only month that has seen an average loss for SPX. We see that 70% of the past ten Septembers have been lower, yet only 30% of non-Septembers have been down months over that period. Combine that with the current streak of four consecutive down Septembers (and a nasty start to the fifth), and it is quite obvious why negative seasonality is a theme.
Unfortunately, the data is far less compelling when we zoom out over a longer timeframe. Contrast the table above with the one below, which offers exactly the same analysis, but over a 20-year, not 10-year span:
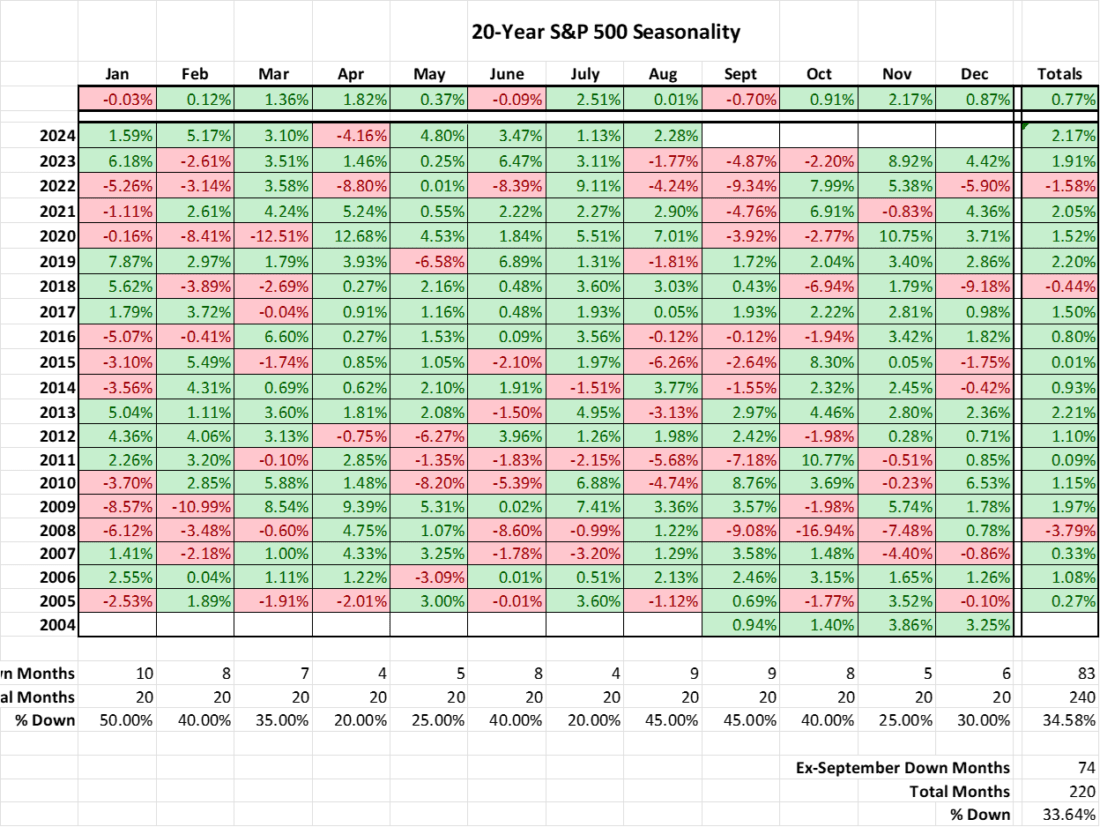
Using data from the past 20 years, which still includes the past four consecutive down occurrences, September doesn’t seem like an outlier. Indeed, it has the worst monthly average performance, but we’re no more likely to see a down September than a down August (both at 45%). January has the highest preponderance of down months (50%). Furthermore, the difference between down Septembers (45%) versus non-Septembers (33.64%) is not especially large.
So, which is it? I’d have to say it’s somehow neither AND both. The recent track record of “September Scaries” is impossible to ignore. Over time, however, seasonality is a far more nebulous concept. Those of us with long careers in the markets have vivid memories of the 2008 Lehman aftermath and the Crash of 1987, but October has been an up month on balance – even including the 2008 debacle. Conversely, we have all heard about the January effect, when the prior year’s loser lead an advance when the calendar turns, but over the past 20 years it has been a literal coin-flip.
Thus, can we blame today’s lousy morning on seasonality. No, but there are other factors at work. Friday’s rally was an outlier, powered higher by the rare combination of thin pre-holiday trading and a month end. I offered the following warning on social media just after Friday’s open and just after the close:
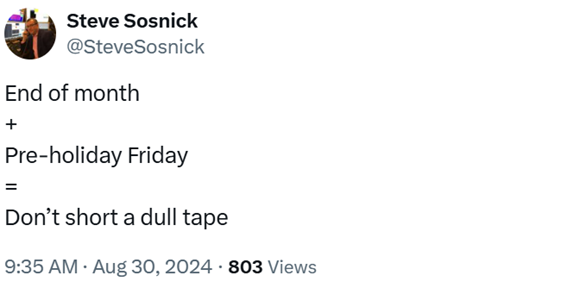
And
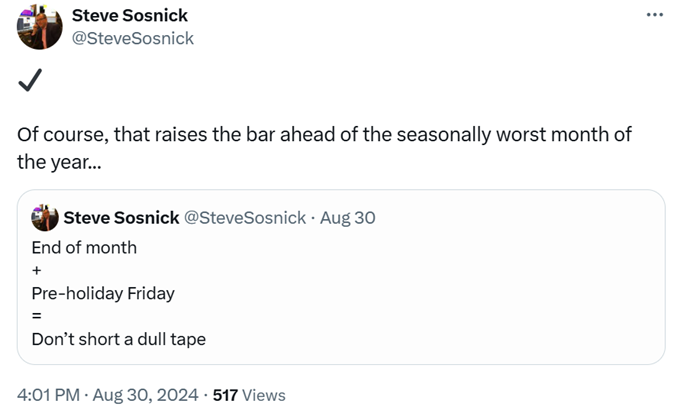
These comments didn’t exactly light up the Twitterverse, but they were useful both for those who paid attention and for explaining the two-day swing. Friday afternoon’s rally was clearly an end-of-month markup, both in hindsight and in real-time, so we’re giving back that rally – and then some today.
3-Day Chart, SPX (1-Minute red/green candles), NDX (blue line)
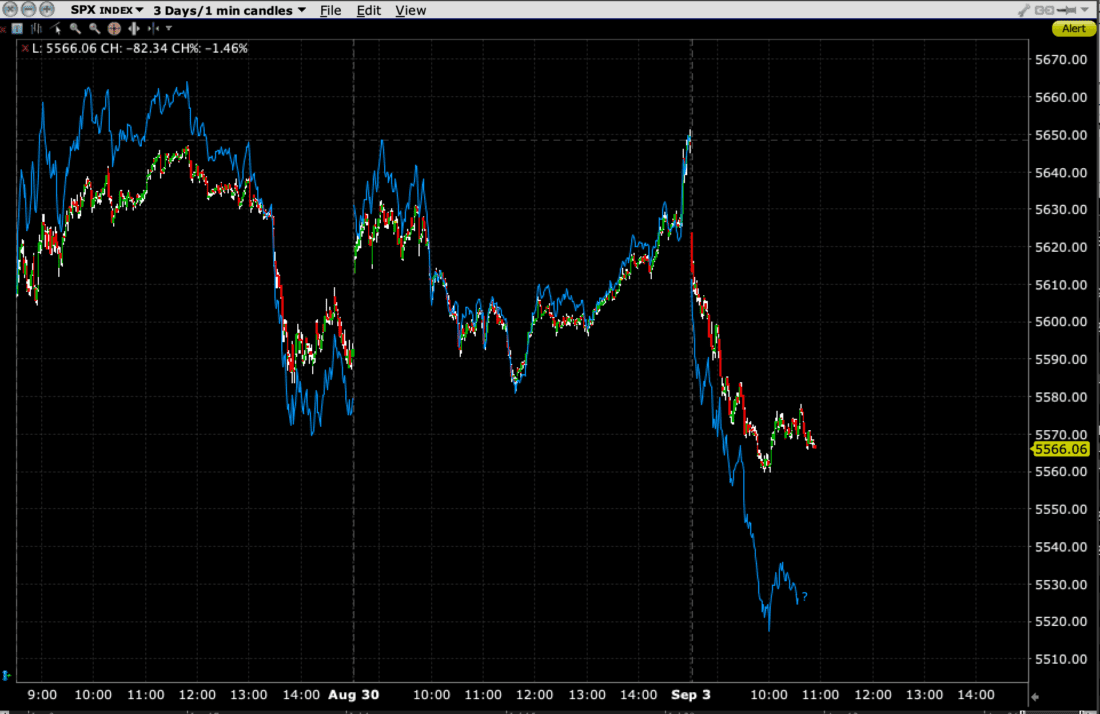
It was as though some traders were doing their best to try to push SPX to a new all-time closing high, but Friday’s 5,648.40 fell short of July 16th’s 5,667.20. The Nasdaq 100 (NDX) close of 19,574.64 was nowhere close to its July 10th all-time high of 20,675.38, by the way. That speaks highly about the recent broadening of the equity market rally, as we are no longer as dependent upon major technology stocks to power SPX higher, but it also brings up an ominous precedent. In late 2021, NDX topped out on November 19th, before sliding nearly 33% in 2022. SPX didn’t top out until about six weeks later, on the first trading day of 2022. That index subsequently fell over 19% that year. This seems like rhyming history, even if we have no idea whether it will repeat.
Disclosure: Interactive Brokers
The analysis in this material is provided for information only and is not and should not be construed as an offer to sell or the solicitation of an offer to buy any security. To the extent that this material discusses general market activity, industry or sector trends or other broad-based economic or political conditions, it should not be construed as research or investment advice. To the extent that it includes references to specific securities, commodities, currencies, or other instruments, those references do not constitute a recommendation by IBKR to buy, sell or hold such investments. This material does not and is not intended to take into account the particular financial conditions, investment objectives or requirements of individual customers. Before acting on this material, you should consider whether it is suitable for your particular circumstances and, as necessary, seek professional advice.
The views and opinions expressed herein are those of the author and do not necessarily reflect the views of Interactive Brokers, its affiliates, or its employees.
