ICYMI: Top Ten Charts for October 2024
Investopedia is partnering with CMT Association on this newsletter. The contents of this newsletter are for informational and educational purposes only, however, and do not constitute investing advice. The guest authors, which may sell research to investors, and may trade or hold positions in securities mentioned herein do not represent the views of CMT Association or Investopedia. Please consult a financial advisor for investment recommendations and services.
Top Ten Charts for October 2024: What I’m Watching and Why You Should Too
I’m going to walk you through my top ten charts to watch for October 2024. We’re covering a mix of sectors, investment ideas, and chart patterns—all of which, I believe, present compelling opportunities this month. Make sure you hit the video below for all the beautiful charts to support the discussion! Grab a coffee, settle in, and let’s explore some charts together.
1. Comcast (CMCSA): A Rounded Bottom Worth Watching
Starting with Comcast, which, to be frank, has been a “nothing burger” for much of the past six months. (Yes, that’s a technical term.) However, recently, this chart has started to look a lot more promising. Comcast is showing signs of forming a rounded bottom, meaning it’s transitioning out of a downtrend and stabilizing.
For several months now, it’s been hovering around $37, bouncing every time it tested that level. The big move recently was when the stock broke above its 200-day moving average. A sustained move above $41.50 would confirm that buyers are truly stepping in. If that happens, Comcast might finally be ready to start climbing.
2. AT&T (T): Consistent Uptrend
Next, we have AT&T—a chart that has made my top ten list consistently. AT&T is a classic example of a steady uptrend: higher highs, higher lows, and consistent performance. With a dividend yield of around 5%, it also offers income potential, which can be particularly attractive in a choppy October market.
The price remains above two upward-sloping moving averages, a good sign for continued growth. For anyone looking for stability, AT&T has been an excellent candidate, providing a strong backbone to portfolios during uncertain times.
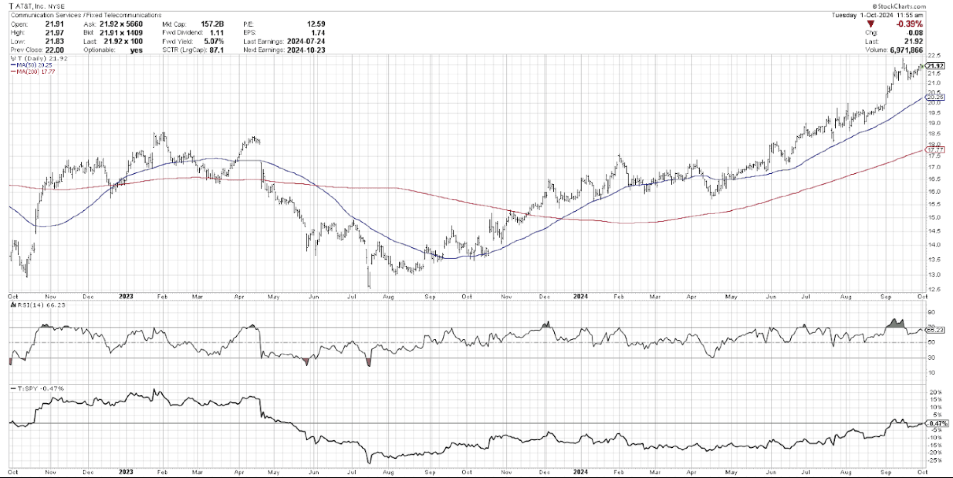
Courtesy of StockCharts.com
3. Baidu (BIDU): A Revival with Chinese Internet Stocks
Baidu is next, and it’s a particularly interesting one given the recent policy changes out of China. With the Chinese government implementing easing measures, many Chinese internet stocks, including Baidu, have experienced an impressive rally. Baidu recently broke above its 200-day moving average—a significant event, as it had struggled to do this for over a year.
When the Relative Strength Index (RSI) moves above 80, we call it “the good overbought”—an indicator that the trend is still in play. Baidu is giving off those signals now. If it manages to hold above $100, this could continue to be a solid opportunity moving forward.
4. Spotify (SPOT): Riding the Uptrend
Spotify is another chart worth your attention. Unlike many other big names, Spotify has largely ignored broader market volatility and maintained a strong uptrend throughout 2024. It consistently bounced from its 50-day moving average, making it a great candidate for a “buy the dip” strategy.
If we see a pullback into the $320–$340 range, it might present an appealing entry point. Spotify’s chart resembles that of a bouncing ball—every dip is met with renewed buying enthusiasm, reinforcing its steady trend.
5. Meta Platforms (META): Assessing a Breakout
Meta Platforms is an important chart to monitor this month, especially considering its position within the broader “Magnificent Seven” tech names. After months of resistance around $540, Meta finally broke above this level, making a new all-time high.
Now, the real question is whether it can sustain that breakout. Holding above $540 will be key for continued gains. If it does, the uptrend could very well continue. However, if it falls back below this level, it could indicate a failed breakout, requiring a reassessment.
6. VF Corp (VFC): A Transition from Weakness to Strength
VF Corp is a compelling story of turnaround—a textbook example of moving from a distribution phase (decline) to an accumulation phase (buying). For much of the year, the stock was in a downtrend, but after hitting a low in April, we started seeing higher highs and higher lows. The breakout above the 200-day moving average and the subsequent strength have signaled a potential long-term accumulation phase. VF Corp is now innocent until proven guilty; as long as it remains in an uptrend, it deserves a spot on the watchlist.
7. Lennar (LEN): A Strong Case
Lennar represents an entire group that’s interesting to watch—the homebuilders. Lower interest rates are generally good for homebuilders, and Lennar is no exception. After a notable decline in 2022, Lennar has rebounded and maintained an impressive uptrend, bouncing from its 200-day moving average multiple times.
Recently, we’ve seen Lennar hit new highs above $170 and then use that level as support—a classic case of resistance becoming support. This sector might benefit further if interest rates continue to decrease, making Lennar a notable chart to watch in October.
8. Dentsply Sirona (XRAY): Bullish Divergence
Dentsply Sirona presents an example of a bullish momentum divergence, which is essentially a fancy way of saying that even though price was falling, momentum indicators were improving. This divergence often signals an impending reversal, much like when you try to hold a beach ball underwater—it eventually pops back up.
The stock has now moved back above its 50-day moving average and looks poised for further gains. The next step is to see if it can break above its July highs and its 200-day moving average, which would confirm a strong trend reversal.
9. Freeport-McMoRan (FCX): A Reversal After a Head and Shoulders Top
Freeport-McMoRan recently completed a classic head and shoulders top pattern, which initially suggested a decline—and that’s exactly what happened. The stock hit a target near $40, then rebounded. It’s now making higher highs and higher lows, indicating the potential for a new uptrend.
This is one of those textbook rotations that trend followers love to see. If we get a pullback and then a continuation higher, it could present a great entry opportunity.
10. Gold Miners (GDX): A Reliable Hedge
The last chart to discuss is GDX, the gold miners ETF. Gold has been a go-to hedge in times of uncertainty, and gold miners often perform well when the metal itself is in an uptrend. GDX has repeatedly found support at its 50-day moving average, making each pullback a buying opportunity.
If October proves as unpredictable as it often can be, GDX might be a great place to allocate some capital. As long as the uptrend remains intact, gold miners look like a solid bet.
Final Thoughts
These charts include a mix of long-term trends, potential breakouts, and interesting turnarounds, each offering unique opportunities depending on your risk appetite and investment approach.
One thing to keep in mind is that trend-following is all about observing where the momentum is and riding that wave for as long as it lasts. Like my mentor always said: “In an uptrend, you know we’re going up—just make sure we make a higher low.” It’s about staying nimble, managing risk, and letting the charts tell the story.
—-
Originally posted 8th October 2024
Disclosure: Investopedia
Investopedia.com: The comments, opinions and analyses expressed herein are for informational purposes only and should not be considered individual investment advice or recommendations to invest in any security or to adopt any investment strategy. While we believe the information provided herein is reliable, we do not warrant its accuracy or completeness. The views and strategies described on our content may not be suitable for all investors. Because market and economic conditions are subject to rapid change, all comments, opinions and analyses contained within our content are rendered as of the date of the posting and may change without notice. The material is not intended as a complete analysis of every material fact regarding any country, region, market, industry, investment or strategy. This information is intended for US residents only.
Disclosure: Interactive Brokers
Information posted on IBKR Campus that is provided by third-parties does NOT constitute a recommendation that you should contract for the services of that third party. Third-party participants who contribute to IBKR Campus are independent of Interactive Brokers and Interactive Brokers does not make any representations or warranties concerning the services offered, their past or future performance, or the accuracy of the information provided by the third party. Past performance is no guarantee of future results.
This material is from Investopedia and is being posted with its permission. The views expressed in this material are solely those of the author and/or Investopedia and Interactive Brokers is not endorsing or recommending any investment or trading discussed in the material. This material is not and should not be construed as an offer to buy or sell any security. It should not be construed as research or investment advice or a recommendation to buy, sell or hold any security or commodity. This material does not and is not intended to take into account the particular financial conditions, investment objectives or requirements of individual customers. Before acting on this material, you should consider whether it is suitable for your particular circumstances and, as necessary, seek professional advice.
Disclosure: ETFs
Any discussion or mention of an ETF is not to be construed as recommendation, promotion or solicitation. All investors should review and consider associated investment risks, charges and expenses of the investment company or fund prior to investing. Before acting on this material, you should consider whether it is suitable for your particular circumstances and, as necessary, seek professional advice.
