Stagflationary winds hit the economic landscape this morning as a hotter-than-expected CPI was met with loftier-than-projected unemployment claims. The data is leading to yield curve steepening, as rate watchers are confident that the Fed is favoring labor market health over price stability. Bond vigilantes are once again pushing up rates for distant borrowing, because they have a strong hunch that inflation and deficit spending will remain a feature of US economics over the long haul. Meanwhile, equity investors are unfazed by news that weekly layoffs hit the tallest level in over a year and they remain motivated by persistent optimism regarding AI.
September Inflation Exceeds Expectations
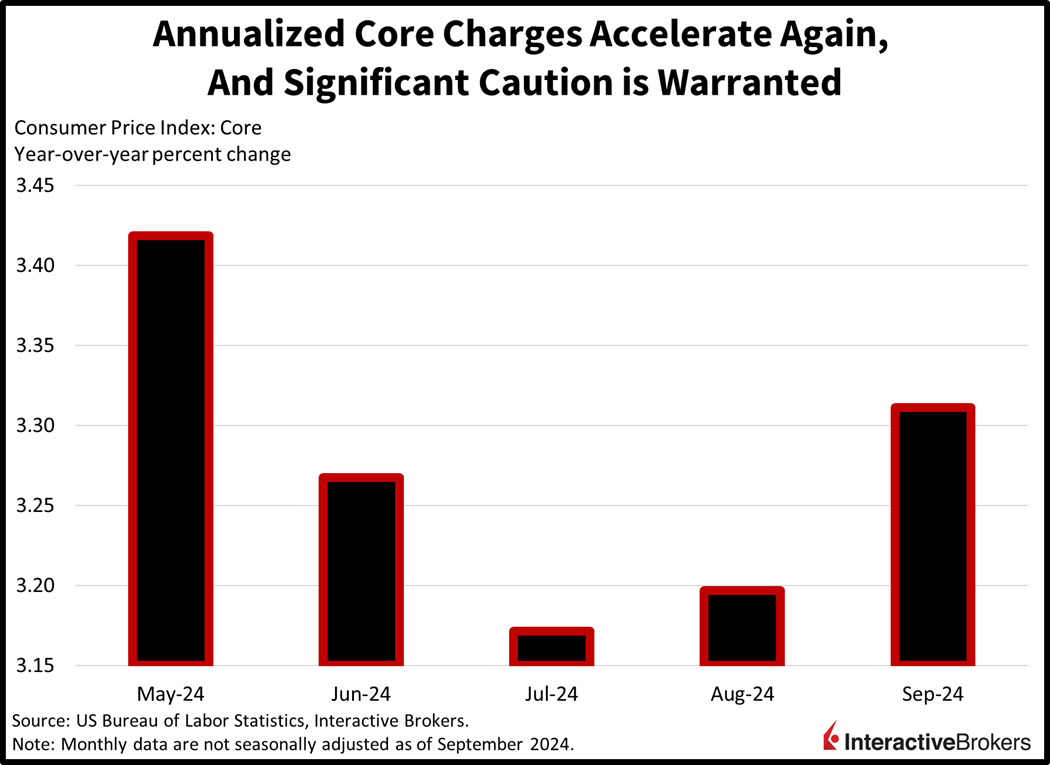
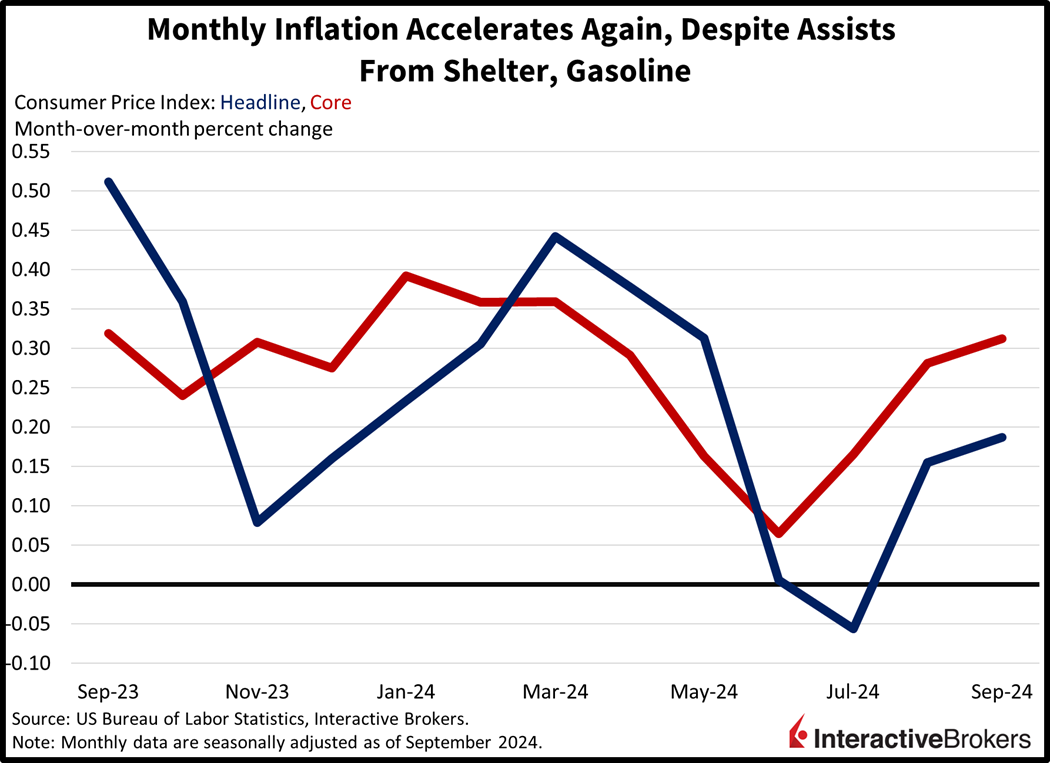
September’s inflation arrived hotter than analyst consensus forecasts, which we expected and communicated in our commentary yesterday. This morning’s Consumer Price Index (CPI) release also featured the first year-over-year (y/y) acceleration in core since March, illustrating the slow path to containing price pressures. The CPI rose 0.2% month over month (m/m) and 2.4% y/y with each result exceeding Street estimates by 0.1%. The core version of the indicator, which excludes food and energy due to their volatile characteristics, increased 0.3% m/m and 3.3% y/y compared to consensus expectations of 0.2% and 3.2%. The headline m/m outcome matched August’s result but the y/y number headed south by 0.1%. The core m/m also matched last month’s counterpart but was up by 0.1% y/y.
The only major category to experience reduced charges was gasoline, with a 4.1% decline. Categories that sported increases and the amounts of the price hikes were as follows:
- Transportation services, 1.4%
- Apparel, 1.1%
- Energy services, 0.7%
- Medical care services, 0.7%
- Food at home, 0.4%
- Food away from home, 0.3%
- Used cars and trucks, 0.3%
- New vehicles, 0.2%
- Shelter, 0.2%
Report Is Concerning
One discouraging development is that the collective assist from decelerating shelter costs and contracting gasoline prices didn’t drive a figure that matched projections. Another consideration is that we witnessed broad-based pressure from almost every category, which is unfavorable when considering that the Fed just went out of its way to deliver a 50-basis point (bps) reduction to its key benchmark. Furthermore, this month isn’t trending well from a price perspective, with commodities up sharply and a buoyant stock market likely to intensify demand for gasoline, goods and services. The Fed is risking a 1970s déjà vu, when progress on inflation was reversed by excessive dovishness amidst undue complacency.
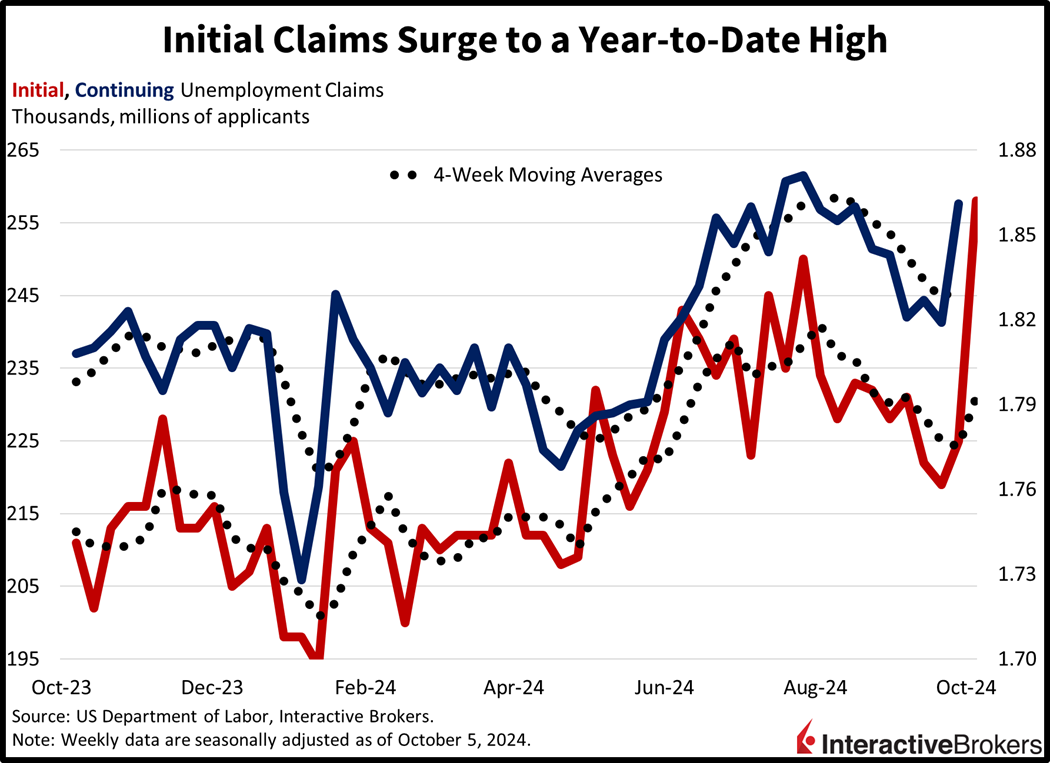
Labor Turmoil and Hurricane Push Unemployment Claims Higher
Unemployment claims were higher than expected last week, in part due to the Boeing and port labor strikes and Hurricane Helene. For the seven-day period ended Oct. 5, initial claims reached 258,000, significantly above the median estimate of 231,000 and the previous week’s 225,000. It was the highest number of claims since August 5, 2023, when 258,000 individuals were handed pink slips. Furthermore, continuing claims arrived at 1.861 million for the week closing on Sept. 28, up from the prior period’s 1.819 million, and soared past the median estimate of 1.830 million. Four-week moving averages ticked north on both fronts from 224,250 and 1.827 million to 231,000 and 1.832 million.
One-Trick Pony
Markets are buoyant for the most part with the S&P 500 inching closer to another all-time high despite mounting uncertainty regarding the fixed income complex, the labor market, the inflationary front and corporate earnings. It’s a narrow rally though, with just 3 out of 11 sectors gaining, which is weighing on the Russell 2000 and Dow Jones Industrial indices; they’re down 0.7% and 0.1%. But the S&P 500 and Nasdaq 100 benchmarks are both up close to 0.1% as artificial intelligence (AI) optimism leads to huge buying pressure in Nvidia, which is up 1.8% and close to reaching a fresh all-time high close if it can hold on to gains. Additionally, progress of 1%, 0.3% and 0.2% in the energy, materials and technology segments is helping to offset the weakness in real estate, industrials and financials. Those components are losing 0.6%, 0.3% and 0.3%. In fixed-income, currency and commodity land, we’re seeing the yield curve shift in a steepening motion, with the 2- and 10-year Treasury maturities changing hands at 3.97% and 4.09%, 5 bps lighter on the former but 2 bps taller on the latter. The dollar is taking its cue from the long end and is up 5 bps as it appreciates against the euro, pound sterling, yuan and Canadian tender while it depreciates versus the franc, yen and Aussie notes. Commodity investors are bullish as they feel the inflationary impulse, which is causing crude oil, silver, gold and copper to bounce 2.8%, 2.2%, 0.8% and 0.7%, but lofty mortgage rates are weighing on lumber as its down 0.6%. WTI crude is trading at $75.47 per barrel on supply worries related to Hurricane Milton as well as rising hostilities between Jerusalem and Tehran.
More Data on Tap
Looking ahead to tomorrow, we will get the second half of the one-two combo of inflationary pressures when the Producer Price Index is released. We will also receive UMich’s Consumer Sentiment report. Similar to today’s mix, the data will offer clues on the Fed’s walk down the monetary policy stairs as well as the durability of household spending. Additionally, I’ll be looking for commentary within the University of Michigan’s release on how folks are feeling about the election, which still presents massive uncertainty despite the complacency being flaunted by equity bulls. In fact, Delta Air Lines (DAL) this morning warned that it expects the national event to trim one percentage point from its fourth quarter revenue growth. Similar trends of choppy spending have occurred in the months leading up to previous elections, says CEO Ed Bastian. Finally, here in our IBKR Forecast Trader, former President Trump’s odds are benefiting from recent momentum on the campaign trail, with our participants offering Vice President Harris a probability of 51%, down from yesterday’s 52%.
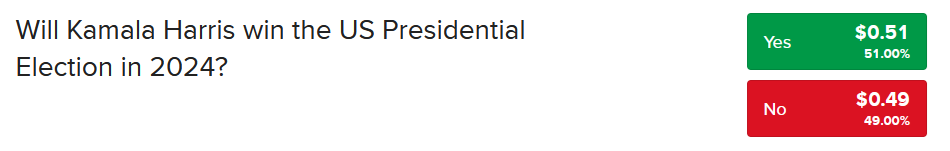
Source: ForecastEx
To learn more about ForecastEx, view our Traders’ Academy video here
Disclosure: Interactive Brokers
Information posted on IBKR Campus that is provided by third-parties does NOT constitute a recommendation that you should contract for the services of that third party. Third-party participants who contribute to IBKR Campus are independent of Interactive Brokers and Interactive Brokers does not make any representations or warranties concerning the services offered, their past or future performance, or the accuracy of the information provided by the third party. Past performance is no guarantee of future results.
This material is from IBKR Macroeconomics and is being posted with its permission. The views expressed in this material are solely those of the author and/or IBKR Macroeconomics and Interactive Brokers is not endorsing or recommending any investment or trading discussed in the material. This material is not and should not be construed as an offer to buy or sell any security. It should not be construed as research or investment advice or a recommendation to buy, sell or hold any security or commodity. This material does not and is not intended to take into account the particular financial conditions, investment objectives or requirements of individual customers. Before acting on this material, you should consider whether it is suitable for your particular circumstances and, as necessary, seek professional advice.
Disclosure: ForecastEx
Interactive Brokers LLC is a CFTC-registered Futures Commission Merchant and a clearing member and affiliate of ForecastEx LLC (“ForecastEx”). ForecastEx is a CFTC-registered Designated Contract Market and Derivatives Clearing Organization. Interactive Brokers LLC provides access to ForecastEx forecast contracts for eligible customers. Interactive Brokers LLC does not make recommendations with respect to any products available on its platform, including those offered by ForecastEx.
Disclosure: Forecast Contracts
Forecast Contracts are only available to eligible clients of Interactive Brokers LLC, Interactive Brokers Hong Kong Limited, and Interactive Brokers Singapore Pte. Ltd.
Disclosure: ForecastEx Market Sentiment
Displayed outcome information is based on current market sentiment from ForecastEx LLC, an affiliate of IB LLC. Current market sentiment for contracts may be viewed at ForecastEx at https://forecasttrader.interactivebrokers.com/en/home.php. Note: Real-time market sentiment updates are only active during exchange open trading hours. Updates to current market sentiment for overnight activity will be reflected at the open on the next trading day. This information is not intended by IBKR as an opinion or likelihood of a potential outcome.
