Investment grade bonds have long been synonymous with a “core” fixed income allocation, but we believe a flexible strategy also belongs in most bond portfolios, as managers can adjust their exposure based on market conditions.
Investment grade (IG) bonds have always been the primary option for core fixed income allocations, and on paper the logic is sound. The IG universe is diverse, default risk is minimal, and liquidity is high. Moreover, IG bonds can act as a buffer when equity markets stumble.
However, in the nearly two decades since the Great Financial Crisis (GFC), IG has revealed its limitations – first during the two zero interest rate periods, and more recently during the latest Fed tightening cycle. In each case, investors were reminded that interest rate risk can adversely impact IG returns, even in the absence of credit risk.
In our view, the best way to protect your core IG allocation is to combine it with an actively managed, flexible strategy that can react to changing market conditions in real time. Not only can these types of strategies limit downside when rates are rising, they can pursue higher yielding alternatives when rates bottom out. Traditional, benchmark-oriented strategies are required to invest roughly the same way regardless of the economic environment and/or the relative merits of a particular sector, which leads to predictably negative returns when conditions are unfavorable.
Our philosophy has always been rooted in common sense. We search for the most attractive areas of the market given the conditions – often high yield (HY) bonds – and then we try to find the least risky way to invest there (mostly by shortening duration, but not always). As you can see from the chart below, we significantly ramped up our HY allocation starting in 2009, after the GFC, when the Fed and other central banks committed to zero (and, in some cases, negative) interest rate policies that lasted until 2016. During that stretch, IG bonds were delivering consistently meager returns, and we felt that HY made much more sense. (As an aside, prior to the GFC we were invested in a more balanced mix of HY, IG, and convertibles.) We have remained primarily in high yield bonds since 2009, as we continue to believe they offer a more attractive risk/return profile than investment grade bonds, but, as you can also see, we have reduced our HY exposure during each of the past two Fed tightening regimes.
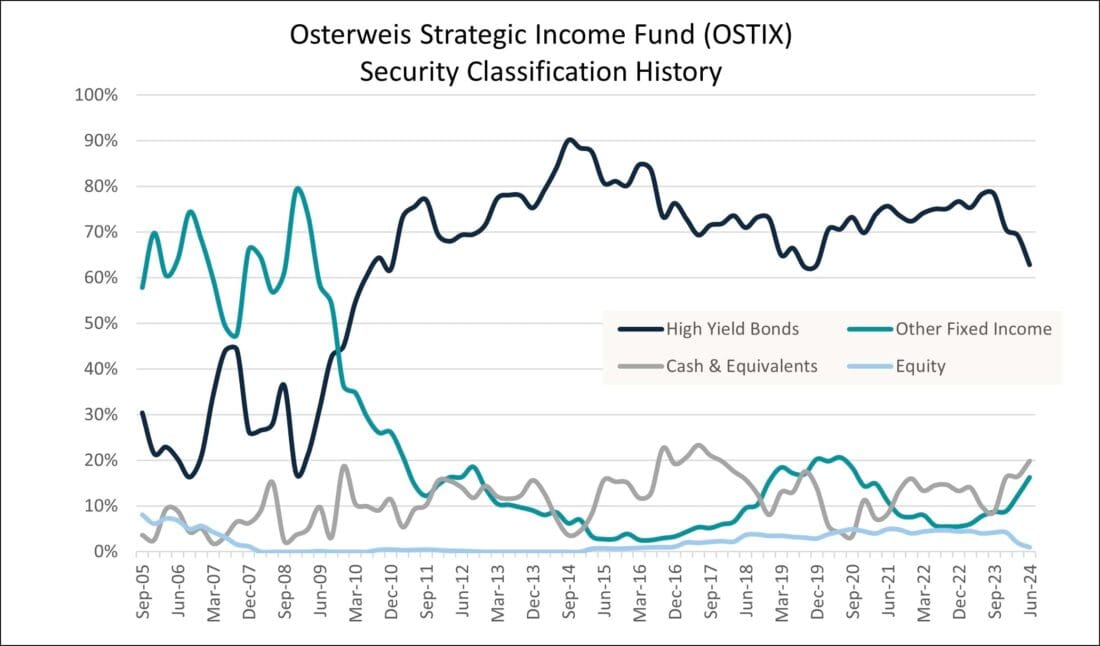
Source: Osterweis Capital Management. The “Other Fixed Income” category consists of IG bonds, convertibles, preferred stock, Treasurys, private MBS, floating rate bonds, and short-term debt (including HY). Prior to 2016, HY bonds maturing within one year were classified as short-term debt and included in “Other Fixed Income”; thereafter such short-term HY bonds were included in the “High Yield” category. Equities consist primarily of stocks received through corporate actions.
We understand that high yield bonds are not typically associated with a core fixed income allocation, but they have worked well for us because we increase/decrease our exposure based on the economic environment and curate what we believe is a more creditworthy selection of companies from the HY universe. Moreover, we pair our HY bonds with cash and other lower-risk securities to dampen our portfolio volatility in times of market exuberance, thereby softening the potential impact of subsequent market corrections. Because HY bonds generally yield more than IG bonds, we do not have to stretch for yield by extending duration or taking excess credit risk. We have been investing this way for over 20 years, and we have delivered substantially higher returns than the Bloomberg U.S. Aggregate (Agg) since our inception, while keeping our volatility nearly in line with the index.
In our view, high yield bonds, also sometimes referred to as “junk,” are a largely misunderstood asset class.1 The distinction between an IG bond and a HY bond is determined entirely by its credit rating. If Moody’s and S&P assign a rating above the cutoff (Ba1 and BB+, respectively), a bond is considered investment grade. If not, it is high yield. We have always felt that dividing such a large and dynamic market into two giant buckets is an oversimplification, and we have dedicated ourselves to exploiting the inefficiencies it creates.
Setting aside the issue that a rating is merely one subjective opinion, roughly 50% of the HY index is BB and 50% of the IG corporate index is BBB. In other words, approximately half of each universe is on the border, which means they have fairly similar default risk.
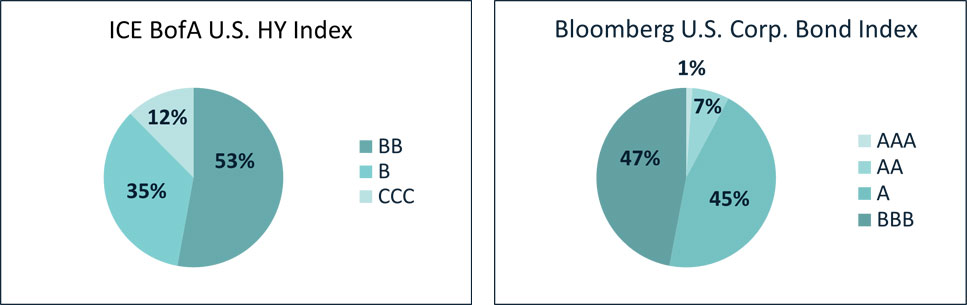
Source: ICE Indices and Barclays Live
The table below shows the annualized default rates of each ratings grade over 5-year, 10-year, and 15-year periods. While the default risk is a little higher for BB than for BBB bonds, the absolute level of risk is still relatively low. Obviously, the risks increase as you move down the ratings scale, but statistically speaking a high-quality HY bond is not substantially different from a low-quality IG bond.
The last row of the table shows the default rates for OSTIX. As you can see, our 5-year rate is comparable to the BB category, but our 10-year rate is roughly half the BB rate, and our 15-year rate is only 11 basis points higher than the BBB rate. In other words, over the long run, the credit risk of our portfolio, which has been primarily high yield bonds, is similar to an investment-grade portfolio.
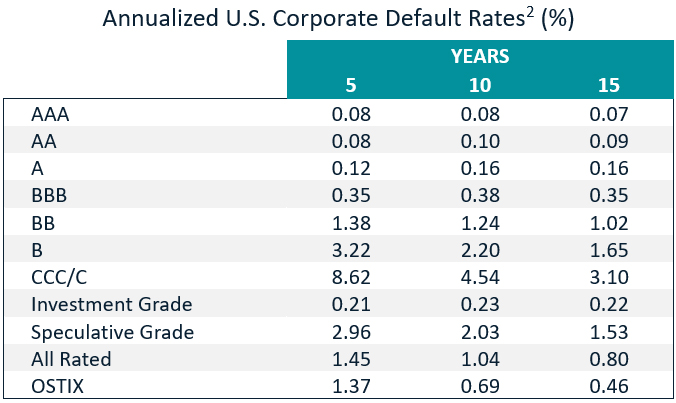
Source: S&P and Osterweis Capital Management. Data as of December 2023.
In addition, the correlation between a bond’s spread, which is the market’s real-time assessment of its credit risk, and its rating is fairly low. Said differently, a BB bond, which is at the top of the HY spectrum, and a CCC bond, which is at the bottom, can have similar spreads, suggesting that once a bond is trading in the open market, most investors do not place much weight on its rating. As you can see in the chart below, every ratings category except the very lowest has a cohort of bonds trading at spreads between 200-500 basis points.
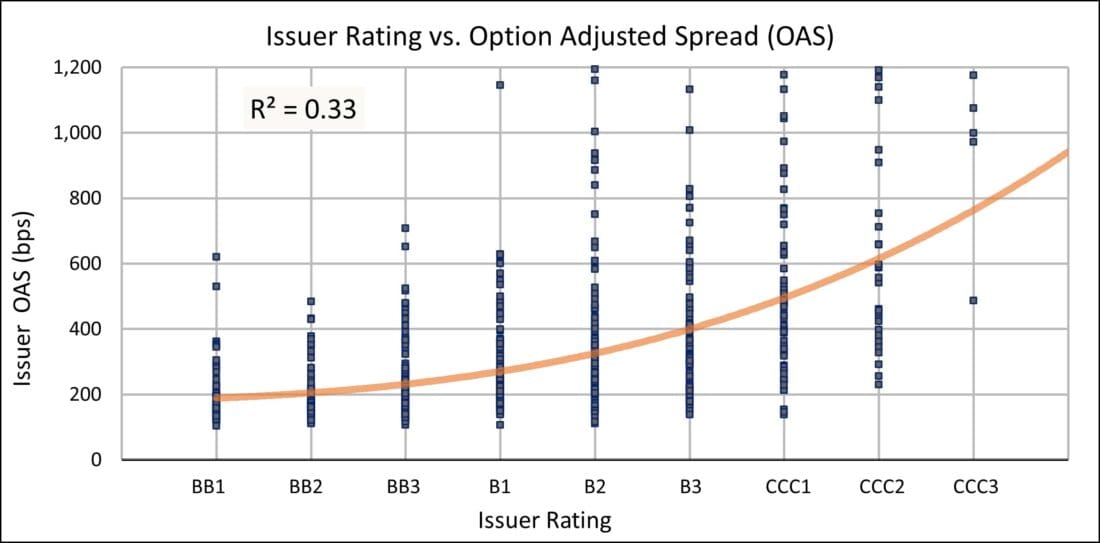
Source: Bank of America Global Research. Data as of June 2024. The dashed lines represent the boundary between 200-500 bps. The curve is the regression line showing the OAS mid-point of each rating grade.
In summary, we believe that there is strong empirical evidence that ignoring HY and dismissing it as “too risky” for a core allocation is essentially a missed opportunity. In our view, leaning into HY, but doing so in a strategic and selective manner, is among the smartest decisions a fixed income investor can make. Because the asset class is so stigmatized, knowledgeable investors can exploit market inefficiencies that others are simply overlooking.
Perhaps our belief in the benefits of HY bonds is rooted in our experience. For over two decades we have been investing in the space, and during that time we have developed an approach to evaluating borrowers that has seldom let us down. Like all managers, we strive to find companies with strong fundamentals and good credit metrics (e.g., coverage ratios, leverage ratios, healthy free cash flow), but we have also always looked for something else that we believe is at least as important. Namely, we are looking to lend money to companies whose incentives are aligned with our own.
For us, it is essential that the borrowers are using leverage strategically and transparently, and that they invest directly into their business, rather than pay themselves large dividends or repurchase their own shares. The classic example is a company that borrows money to build a new factory or expand its geographic footprint – these kinds of investments give the business a chance to grow in the future, which increases its enterprise value and improves the likelihood it will repay its debts in full. In short, we are looking for companies that we believe are good stewards of capital, as they will borrow responsibly and prioritize repayment.
In addition, these types of businesses tend to incorporate stronger covenants into their bonds, which gives us additional protections beyond the company’s verbal promise to repay. Also, they are generally more inclined to allow direct access to their executive teams. This not only helps us conduct stronger due diligence, as we can ask management questions about their business plan, but it also enables us to provide strategic advice in situations where they may need guidance navigating the capital markets.
When we are evaluating a new position, we have found these factors are much more important than a bond’s credit rating, although we tend to be underweight CCCs, as they do not usually meet our investment criteria.
Another technique we use to manage risk is to avoid the most crowded areas of the market, as securities with strong demand are often not particularly attractive. For example, larger bonds that are included in a fixed income index tend to offer below-market yields, as passive funds are essentially required to buy them in order to match their benchmark. As a result, issuers know their bonds will be purchased even if the coupons are below market.
Conversely, sponsor-backed leveraged buyouts (LBOs) have tended to offer competitive yields, which makes them highly sought after, but the terms of the deals are usually quite unfavorable for investors. LBOs are typically led by private equity companies that saddle the underlying business with substantial levels of debt, and they frequently use the proceeds to pay themselves generous dividends. The net result is a company that is left with significantly higher debt service but no improvement in its ability to pay, as they generally have the same base of operations as before the deal.
Our goal has never been to beat a specific index – it has always been to invest in the areas of the market with the most attractive risk/return profiles. Because we have been consistently overweight HY for most of the past two decades, we have substantially outperformed the Agg over that stretch. At the same time, because our HY exposure has always been less than 100%, and has fluctuated according to the market conditions, we have lagged the ICE BofA HY Index, but with substantially less volatility. We have, in essence, deliberately pursued a middle ground, as this allowed us to increase our returns without significantly increasing our risk. As you can see from the chart below, our performance lies almost directly between the IG and HY indices, and our drawdowns during market selloffs are substantially less severe than those of the HY index.
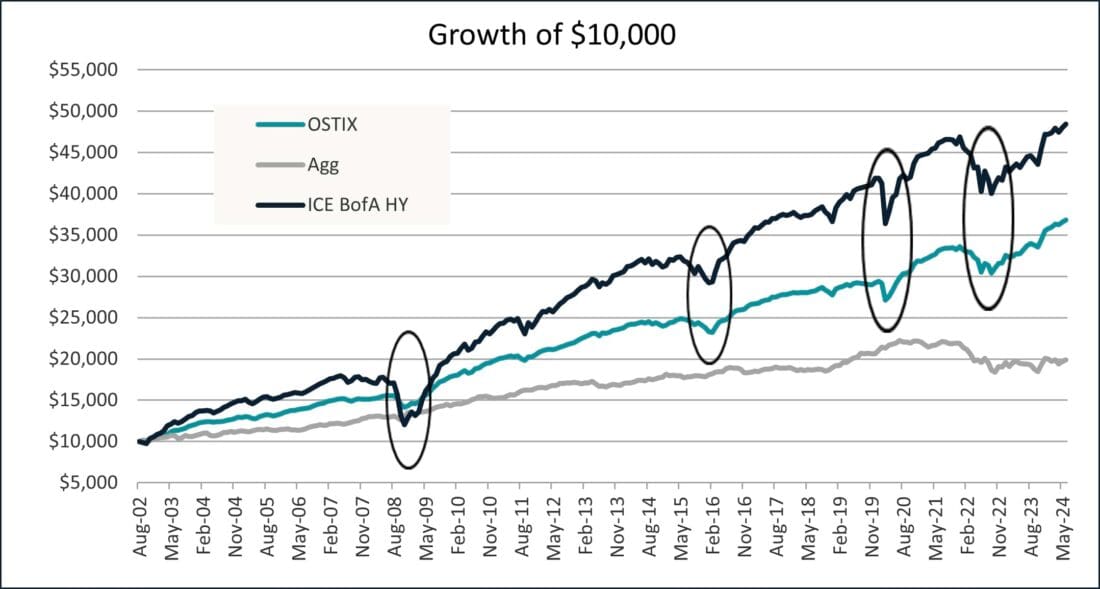
Source: Bloomberg Indices, ICE Indices, Osterweis Capital Management. Data as of 8/30/02-6/30/24. Chart illustrates the performance of a hypothetical $10,000 investment made at the Fund’s inception and assumes the reinvestment of dividends and capital gains, but does not reflect the effect of any applicable sales charge or redemption fees. Such charts do not imply any future performance.
Performance data quoted represent past performance; past performance does not guarantee future results. The investment return and principal value of an investment will fluctuate so that an investor’s shares, when redeemed, may be worth more or less than their original cost. Current performance of the Fund may be higher or lower than the performance quoted. Performance data current to the most recent month end may be obtained by calling shareholder services toll free at (866) 236-0050.
The table below puts a finer point on the fund’s ability to deliver returns while still managing volatility. As you can see, over the past 20 years, our return is substantially higher than the Agg, our standard deviation is nearly identical, and our Sharpe ratio is significantly higher than both indices.
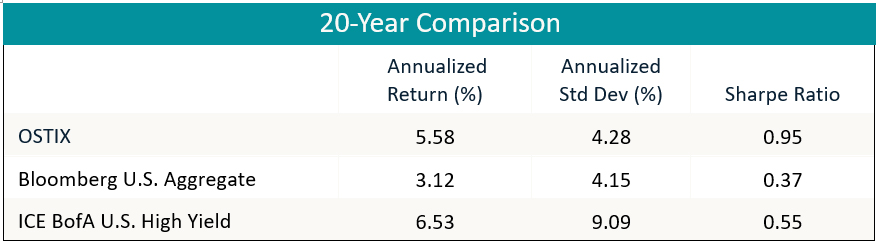
Source: eVestment. Data as of 6/30/24. Please see disclosures for standardized performance chart.
In our view, investors have been thinking too narrowly about their core fixed income allocation for too long. Interest rate cycles have predictable results for investors of traditional core funds, which generally track the Agg. Those funds will almost always struggle when interest rates rise, as their managers have limited options available to protect their portfolios. Likewise, they will struggle when the Fed cuts rates aggressively, as they will not generate enough yield to deliver meaningful returns.
An actively managed, flexible strategy, on the other hand, has the ability to move into sectors that are suited to a particular environment (and vice versa), whether the change is triggered by an interest rate move or a change in the credit cycle. As we have demonstrated over the past 20+ years, being nimble in the fixed income market is more important than adhering to the orthodoxy around what makes up a “core” fund.
—
Originally Posted October 22, 2024 – The Benefits of a Flexible Core
1 You can watch a replay of our webinar, “Not All High Yield Is Junk,” to hear our detailed thoughts on the virtues of high yield bonds.
2 The figures in the non-OSTIX rows in the above table are calculated by S&P for corporate bonds. The OSTIX default rates are calculated by Osterweis using all the bonds held by OSTIX and are based on a methodology similar to that of the S&P.
Disclosure: Interactive Brokers
Information posted on IBKR Campus that is provided by third-parties does NOT constitute a recommendation that you should contract for the services of that third party. Third-party participants who contribute to IBKR Campus are independent of Interactive Brokers and Interactive Brokers does not make any representations or warranties concerning the services offered, their past or future performance, or the accuracy of the information provided by the third party. Past performance is no guarantee of future results.
This material is from Osterweis Capital Management and is being posted with its permission. The views expressed in this material are solely those of the author and/or Osterweis Capital Management and Interactive Brokers is not endorsing or recommending any investment or trading discussed in the material. This material is not and should not be construed as an offer to buy or sell any security. It should not be construed as research or investment advice or a recommendation to buy, sell or hold any security or commodity. This material does not and is not intended to take into account the particular financial conditions, investment objectives or requirements of individual customers. Before acting on this material, you should consider whether it is suitable for your particular circumstances and, as necessary, seek professional advice.
