From SIA Charts
How To Properly Interpret Bullish Percent Indexes
Investopedia is partnering with CMT Association on this newsletter. The contents of this newsletter are for informational and educational purposes only, however, and do not constitute investing advice. The guest authors, which may sell research to investors, and may trade or hold positions in securities mentioned herein do not represent the views of CMT Association or Investopedia. Please consult a financial advisor for investment recommendations and services.
How To Properly Interpret Bullish Percent Indexes
This week, we are dedicating our entire focus to disecting the energy trade. We began with Exxon Mobil, one of the largest energy companies in the world, as a proxy for big oil. On Tuesday, we examined the energy services company Weatherford as a proxy for the service industry. Yesterday, we conducted a technical dive into the Pipeline and Infrastructure sector of the energy landscape, where we identified promising names like Targa Resources and TC Energy Corp as outperformers within the sector. Today, we will explore Oil and Gas from yet another perspective, focusing on the Bullish Percent Index (BPI). This will serve two purposes: first, to provide insights into money flows within the energy sector, and second, to educate advisors on how to utilize this tertiary tool, often employed by elite investment advisors. It is often said that using technical analysis alongside fundamentals is akin to playing the piano with both hands. In this analogy, employing bullish percents is like using the foot pedals. Just as the pedals enhance and alter the piano’s sound, allowing you to shape its character and tone, bullish percents can be used alongside key indicators such as relative strength and fundamentals to further refine your market understanding.
To say that today’s Equity Leaders Weekly is an advanced report is an understatement. Please have patience as you read and develop your technical skills. Save this edition for future reference, as it contains powerful insights that will enhance your technical prowess. Just as the pedals are a powerful addition to a pianist’s skills, bullish percent indexes are invaluable for elite investment advisors. Simply put, a Bullish Percent Index (BPI) is a breadth indicator based on the number of stocks on Point & Figure Buy Signals within an index. The BPI helps you gauge the internal health of an index by assessing the number of components on a bullish or bearish track. Remember, there is no ambiguity on P&F charts; a stock is either on a P&F Buy Signal or a P&F Sell Signal. However, the bullish percent takes this a step further by analyzing the aggregate data and plotting the percentage of stocks exhibiting bullish or bearish patterns.
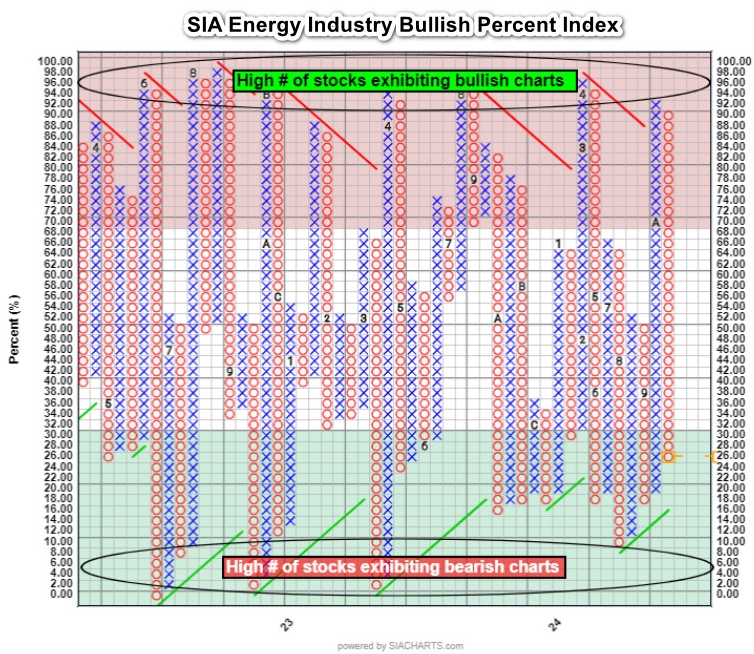
Technicians new to using bullish percent often mistakenly believe that a high reading (above 70%, in the Red Zone) indicates danger and overbought conditions, but nothing could be further from the truth. A high reading is, in fact, a bullish signal. Consider this: if a BPI reading shows that over 70% of stocks on a Point & Figure chart are bullish, does that indicate a risky sector? Conversely, if less than 30% of stocks are on a P&F Buy Signal (the Green Zone), does that sound bullish? The answer is very bearish.

Courtesy of SIA Charts
Now, let’s examine reversals. Consider a chart that starts with a high reading (above 70%) and gaining X’s but then moves into a column of O’s. This signals to advisors that the number of bullish charts is diminishing, indicating that the market or sector is starting to slip. This is significant. In the attached SIA Energy Industry Bullish Percent chart, only 26% of the stocks in this SIA Energy Universe are on a buy signal, and that number continues to decline. While the reading is in the Green Zone, would you consider this bullish or bearish? The answer is decidedly bearish. The point of maximum risk occurred at the reversal level of 86% when the column flipped from X to O with a 3-box reversal, or, in other words, when 6% of the stocks shifted from bullish (increasing) to bearish. The opposite scenario occurs with a 3-box reversal from O to X when the number of stocks in the universe exhibits bullish 1% Point & Figure chart patterns. As the number of bullish charts begins to grow and crosses the +6% threshold, the reading turns positive, indicated by a column of X. This would mark the point of maximum opportunity to enter the sector. However, it is crucial to distinguish this from the main coach of relative strength. Just because a sector becomes positive on its bullish percent chart does not mean it will suddenly outperform on a relative basis; instead, it suggests that risk is diminishing for those seeking exposure, so make sure you keep these two concepts mutually exclusive.
To emphasize this, let me compare it to cliff divers in Hawaii, who must take a leap of faith and jump feet first. Observers note that divers time their jumps to ensure they leap when the rocks are exposed and the water is shallow. Jumping when the waves have engulfed the cliffs, when everything appears safe, can lead to disaster as the rocks will be exposed by the time the jumper hits the water. Now, let’s delve deeper into the Energy Bullish Percent Chart and examine how these readings are calculated.

Courtesy of SIA Charts
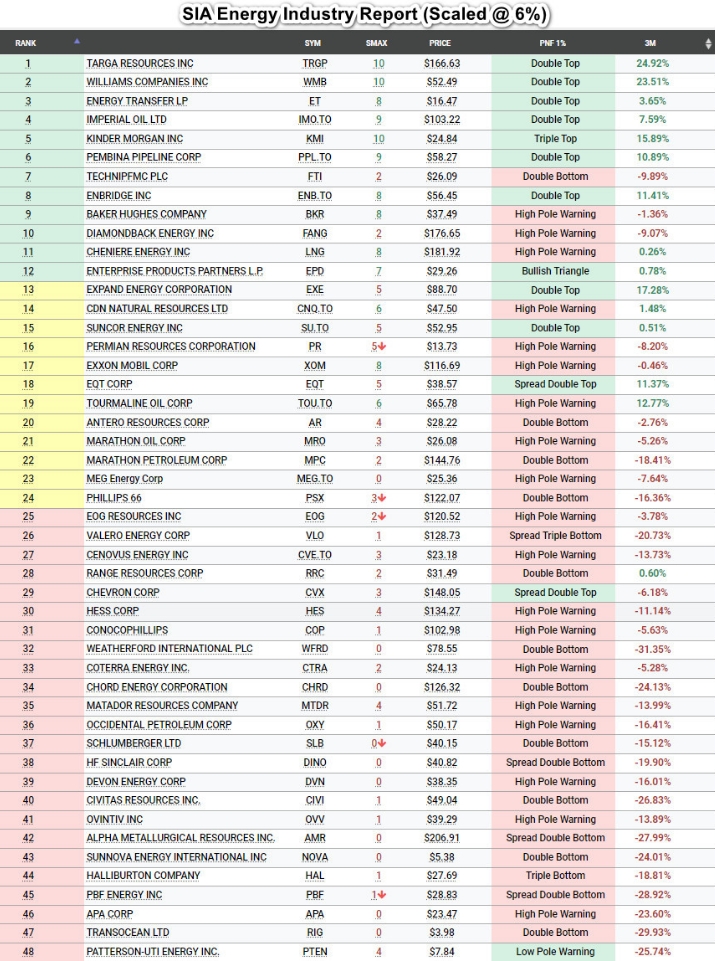
In the table, we have toggled the PNF 1% chart pattern to view the internals of the percentage of charts exhibiting bullish patterns. Out of a statistically significant sample of 48 names, 13 show a positive reading (13/48 = 27%), and this number continues to decline, which is bearish. This exercise could also be applied to high relative strength sectors and conducted at an index or market level, but don’t overthink it; we always consider bullish percent a tertiary indicator. Returning to the cliff diver analogy for this energy BP chart, the wave is still receding, and while the rocks are exposed, the wave is not flooding our jump zone…YET! The beauty of the SIA system is its ability to analyze vast amounts of data each day without fail, alerting SIA practitioners to these changes. For example, this chart indicates the companies still exhibiting positive P&F charts. Notice the green areas in the PNF 1% column, primarily consisting of pipelines we analyzed in yesterday’s report. We will undoubtedly review Patterson (PTEN) at position #48 with a low pole warning, Chevron (CVX) at position #29 with a spread double top, and EQT Corp (EQT), which also has a spread double top pattern, alongside all the names with high SIA relative strength at the top of the report (Favored Green Zone).
What we’re highlighting is that multiple vectors of analysis can be accomplished simultaneously, much like playing the piano with both hands and your feet. This has been an advanced report, and for those who feel confused, please don’t worry. We prioritize relative strength at the top of our analytical hierarchy, but the SIA bullish percent is a valuable tool that can enhance your effectiveness as an investment advisor. We encourage you to invest time in understanding this concept, and we are always available to help—simply reach out to your SIA account managers.
—
Originally posted 1st November 2024
Disclosure: Investopedia
Investopedia.com: The comments, opinions and analyses expressed herein are for informational purposes only and should not be considered individual investment advice or recommendations to invest in any security or to adopt any investment strategy. While we believe the information provided herein is reliable, we do not warrant its accuracy or completeness. The views and strategies described on our content may not be suitable for all investors. Because market and economic conditions are subject to rapid change, all comments, opinions and analyses contained within our content are rendered as of the date of the posting and may change without notice. The material is not intended as a complete analysis of every material fact regarding any country, region, market, industry, investment or strategy. This information is intended for US residents only.
Disclosure: Interactive Brokers
Information posted on IBKR Campus that is provided by third-parties does NOT constitute a recommendation that you should contract for the services of that third party. Third-party participants who contribute to IBKR Campus are independent of Interactive Brokers and Interactive Brokers does not make any representations or warranties concerning the services offered, their past or future performance, or the accuracy of the information provided by the third party. Past performance is no guarantee of future results.
This material is from Investopedia and is being posted with its permission. The views expressed in this material are solely those of the author and/or Investopedia and Interactive Brokers is not endorsing or recommending any investment or trading discussed in the material. This material is not and should not be construed as an offer to buy or sell any security. It should not be construed as research or investment advice or a recommendation to buy, sell or hold any security or commodity. This material does not and is not intended to take into account the particular financial conditions, investment objectives or requirements of individual customers. Before acting on this material, you should consider whether it is suitable for your particular circumstances and, as necessary, seek professional advice.

