Last week, in a piece entitled “S&P 500 Halitosis”, we noted the bad breadth that has accompanied the S&P 500 (SPX) Index this month. In each of December’s eight trading days prior to its writing, SPX decliners had outpaced advancers each day. Despite yesterday’s advance, the streak hit day 11; today’s decline threatens day 12. I can’t find a precedent for the current situation, where the market rose – SPX is currently up 0.3% for the month – amidst a streak of this sort. The longer it goes, the more likely this becomes a concern rather than a statistical fluke.
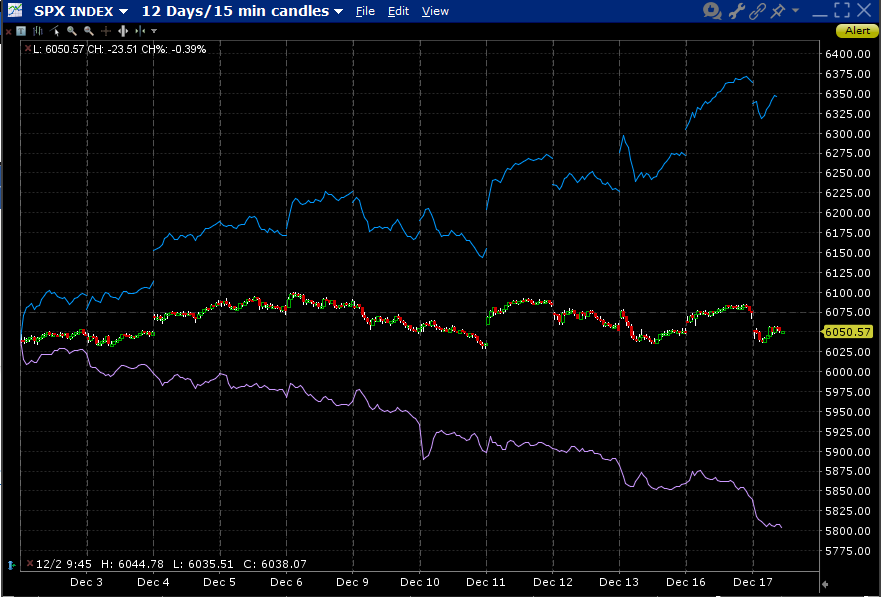
The following graph sums up the screaming divergence in the markets right now. As noted above, SPX is essentially treading water for the month of December. Meanwhile, the Nasdaq 100 (NDX) is up over 5% but the equal-weighted S&P 500 (SPW) is down over 3%. The largest stocks, primarily megacap tech shares, are once again carrying the market.
12-Days, SPX (red/green 15 minute candles), NDX (blue), SPW (purple)

Source: Interactive Brokers
In case you harbor any doubts that the current market environment is a thoroughly tech-focused, story-driven, momentum fest, this chart should puncture them. The key market themes involve semiconductors, crypto, AI, and quantum computing. Of course there is no shortage of overlap among those themes.
Broadcom (AVGO) was up 38% in a stupendous post-earnings rally that ran from Friday through yesterday. The move was triggered by increased guidance, which in turn was spurred by fresh demand for its AI-related chips. It is now the 8th largest component in SPX and #4 in NDX. Thus, it checks the “megacap”, “semiconductor”, “AI” boxes.
The megacap companies that precede AVGO in SPX weight also tend to check multiple boxes. Tesla (TSLA) has some stake in crypto and utilizes AI in its self-driving technology; Meta Platforms (META) has an open-source AI offering. I can go on, but you should get the point.
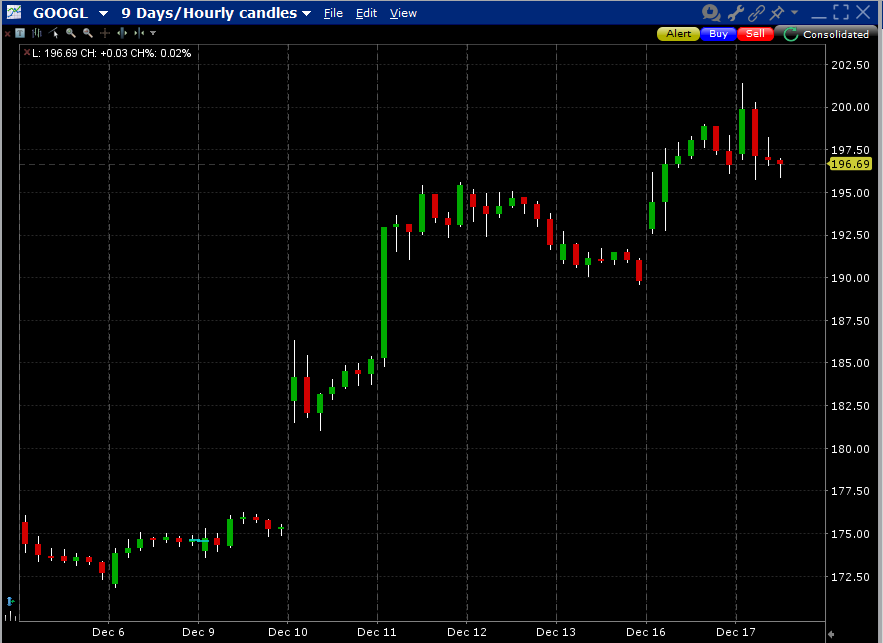
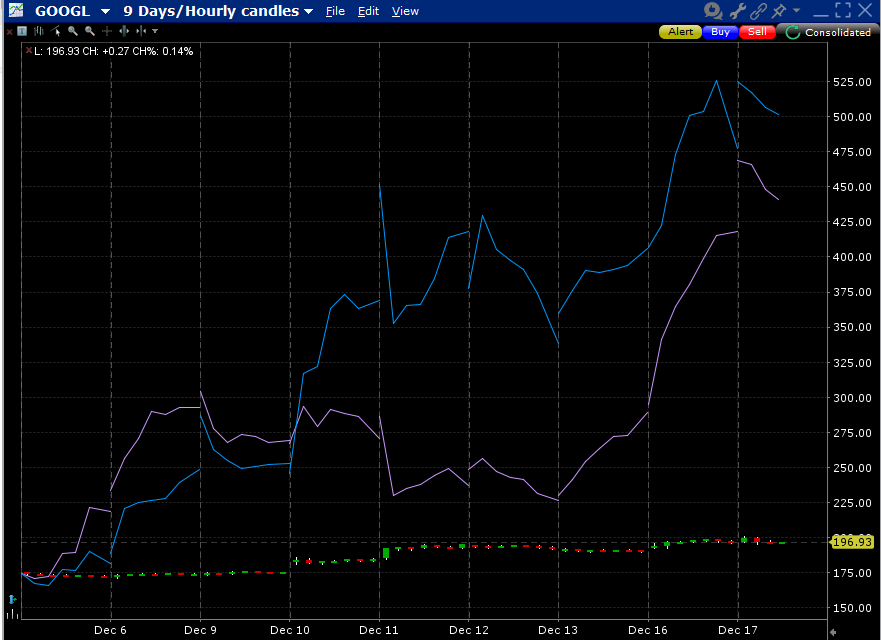
Just last week, Alphabet (GOOG, GOOGL) started a frenzy about quantum computing since announcing a breakthrough in that field. Most of the other beneficiaries are small companies, but who had been paying attention to recent winners like Rigetti (RGTI) and D-Wave Quantum (QBTS)? The following two charts show how much GOOGL has risen since that announcement and how the rally in the megacap pales in comparison to its tiny competitors:
GOOGL 9-Days Hourly Candles

9-Days, GOOGL (red/green hourly candles), RGTI (blue), QBTS (purple)

But is very important to keep the magnitudes of the money in perspective. The stupendous rallies in RGTI and QBTS have pushed their combined market cap to just under $4bn. Meanwhile, GOOGL’s 12% move has added about $300bn in market cap to Alphabet.
Thus if the big boys can keep getting bigger, they can keep SPX afloat. But this raises the fragility inherent in the marketplace. Stock market rallies are best built upon a broad base. If we continually chip away at the market’s foundation, a shock to any of the few remaining pillars increases the chance that it can topple the tower. So far, the recent decline in Nvidia (NVDA) has not been deleterious to the overall market because its shrinkage has been met by growth in AVGO and others. But it is unreasonable to expect this type of rotation to occur indefinitely. If the negative SPX A/D picture continues to weaken, evermore weight rests upon the few remaining pillars. They may not be fragile, but they’re certainly not “anti-fragile.”
Disclosure: Interactive Brokers
The analysis in this material is provided for information only and is not and should not be construed as an offer to sell or the solicitation of an offer to buy any security. To the extent that this material discusses general market activity, industry or sector trends or other broad-based economic or political conditions, it should not be construed as research or investment advice. To the extent that it includes references to specific securities, commodities, currencies, or other instruments, those references do not constitute a recommendation by IBKR to buy, sell or hold such investments. This material does not and is not intended to take into account the particular financial conditions, investment objectives or requirements of individual customers. Before acting on this material, you should consider whether it is suitable for your particular circumstances and, as necessary, seek professional advice.
The views and opinions expressed herein are those of the author and do not necessarily reflect the views of Interactive Brokers, its affiliates, or its employees.

