From SIA Charts
1/ Microsoft Corp. (MSFT)
2/ Point and Figure Chart
3/ Candlestick Chart
Investopedia is partnering with CMT Association on this newsletter. The contents of this newsletter are for informational and educational purposes only, however, and do not constitute investing advice. The guest authors, which may sell research to investors, and may trade or hold positions in securities mentioned herein do not represent the views of CMT Association or Investopedia. Please consult a financial advisor for investment recommendations and services.
1/
Microsoft Corp. (MSFT)

Courtesy of SIA Charts
Microsoft Corp. (MSFT) has been declining within the SIA S&P 100 Index Report, having left the favored zone of the report in late August, when it was squeezed out by many of the financial and banking stocks coinciding with the US Federal Reserve lowering interest rates, which provided support to interest-sensitive stocks. While MSFT’s movement down the matrix appears to be caused by overcrowding in the exclusive favored zone of 25 names in the report and not necessarily a decline in MSFT shares on an absolute basis, they have fallen by -8.03% in the past 6 months. This decline coincides with MSFT leaving the favored zone. Given this pullback, let’s examine some SIA technical diagnostics on the company’s shares to identify any support or resistance on the chart and measure the risk/reward.
2/
Point and Figure Chart
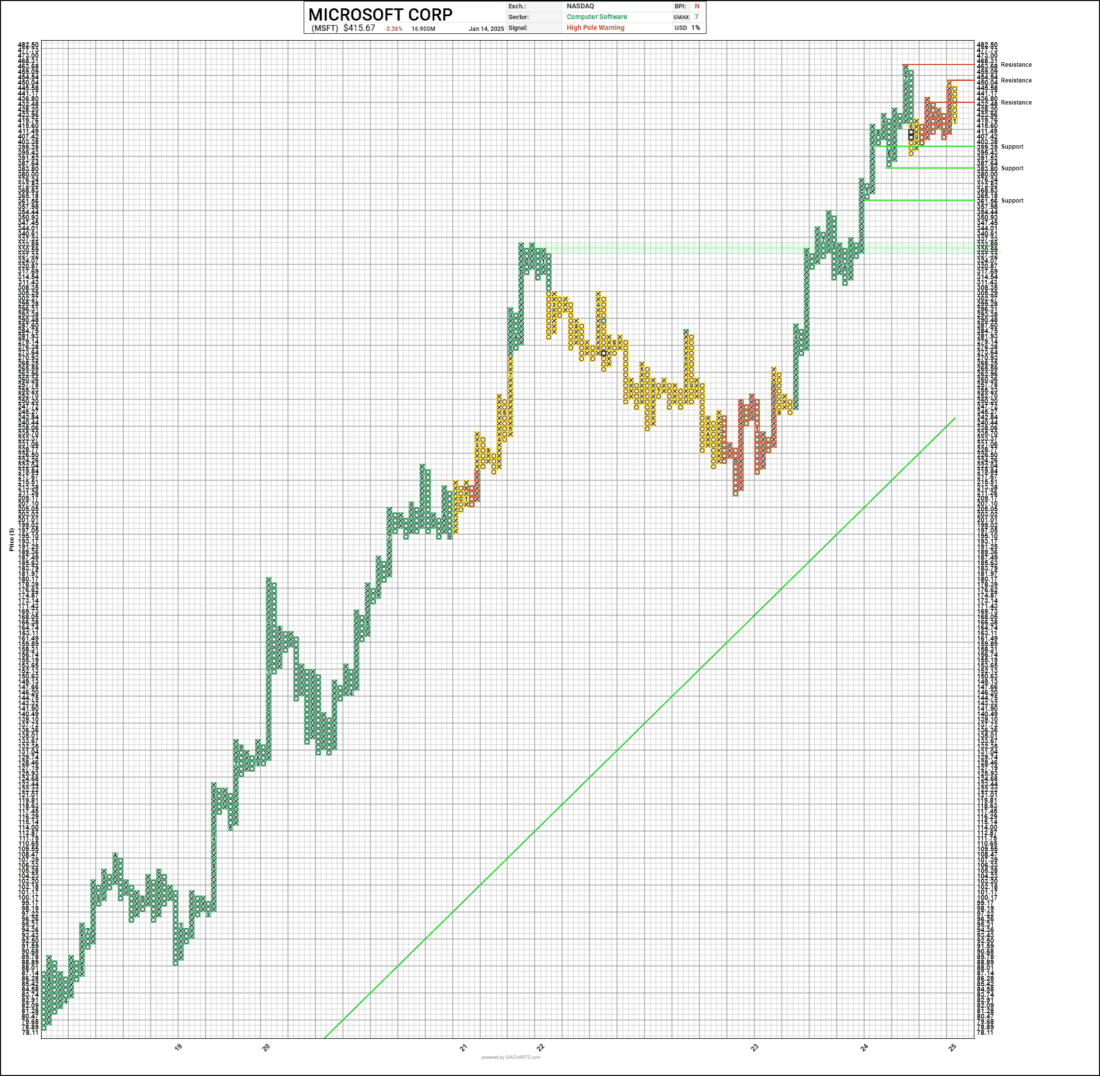
For this exercise, the first step is to examine the point-and-figure chart with a 1% sensitivity and the SIA matrix position overlay tool engaged, which illustrates the position MSFT shares have held over time. Here, we can focus on the move from green to yellow and ultimately the red/yellow flip of late, as MSFT currently sits in the 47th position on the SIA S&P 100 Index Report. According to the rules-based methodology of SIA, this action is enough to exclude MSFT from the portfolios. However, for those waiting for a marked improvement, it will be important to watch the $399.39 level for support, which is consistent with the psychological level that traders often respect as a pause level. Beyond this, the levels of $383.80 and $361.56 are notable, but solid support does not materialize until $333–$330, which is highlighted in light green. From a resistance standpoint, the 3-box reversal level is at $436.80, followed by $454.54 and the all-time high of $468.31. MSFT still holds some attractive technical attributes, as it remains in the SIA favored sector of Computer Software, which often sends all its constituents higher during rising tides. Additionally, it still holds a positive SMAX score of 7 out of 10 as a near-term measure against other asset classes, although this number has been deteriorating.

Courtesy of SIA Charts
3/
Candlestick Chart
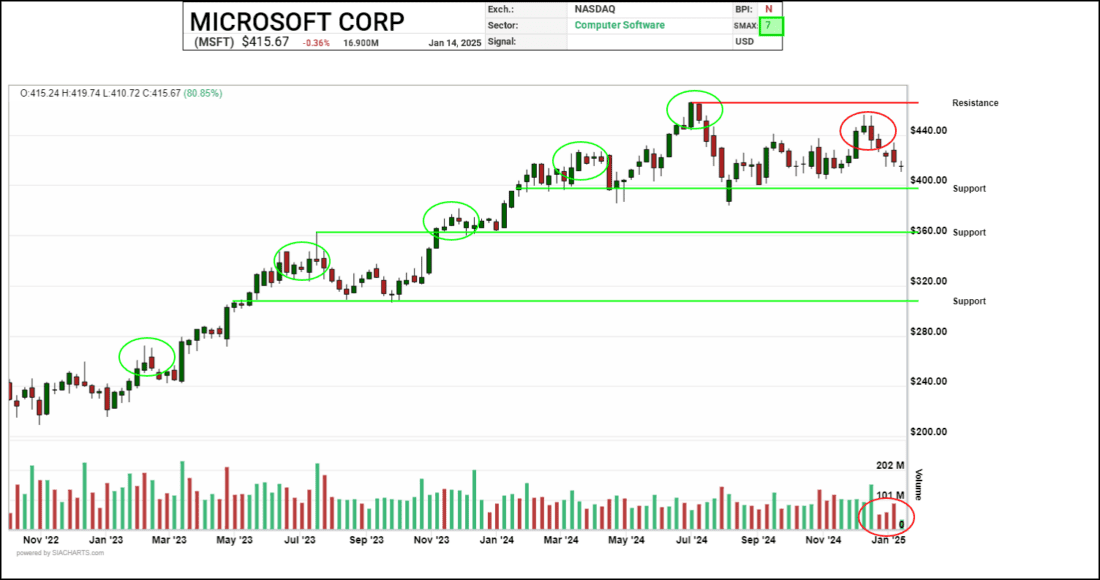
Another way to evaluate MSFT is through a more focused candlestick chart with weekly candles. Here, a clear series of higher highs can be observed from November 2022 onward, except for the latest pullback, which represents the first lower high in several years. This topping formation signals that buyers may not be as committed as before, indicating that the shares could be under distribution. Again, support zones just under $400, $360, and $330 are notable. Also, the recent downtick in volume (see lower red circle) over the past month may be consistent with holiday-level trading but will warrant further observation in the coming weeks. Overall, MSFT presents a mixed technical outlook and may necessitate a review by advisors as near level resistance and lower level support zones may measure poor risk/reward, especially given the lack of SIA relative strength.

Courtesy of SIA Charts
—
Originally posted on 16th January 2025
Disclosure: Investopedia
Investopedia.com: The comments, opinions and analyses expressed herein are for informational purposes only and should not be considered individual investment advice or recommendations to invest in any security or to adopt any investment strategy. While we believe the information provided herein is reliable, we do not warrant its accuracy or completeness. The views and strategies described on our content may not be suitable for all investors. Because market and economic conditions are subject to rapid change, all comments, opinions and analyses contained within our content are rendered as of the date of the posting and may change without notice. The material is not intended as a complete analysis of every material fact regarding any country, region, market, industry, investment or strategy. This information is intended for US residents only.
Disclosure: Interactive Brokers
Information posted on IBKR Campus that is provided by third-parties does NOT constitute a recommendation that you should contract for the services of that third party. Third-party participants who contribute to IBKR Campus are independent of Interactive Brokers and Interactive Brokers does not make any representations or warranties concerning the services offered, their past or future performance, or the accuracy of the information provided by the third party. Past performance is no guarantee of future results.
This material is from Investopedia and is being posted with its permission. The views expressed in this material are solely those of the author and/or Investopedia and Interactive Brokers is not endorsing or recommending any investment or trading discussed in the material. This material is not and should not be construed as an offer to buy or sell any security. It should not be construed as research or investment advice or a recommendation to buy, sell or hold any security or commodity. This material does not and is not intended to take into account the particular financial conditions, investment objectives or requirements of individual customers. Before acting on this material, you should consider whether it is suitable for your particular circumstances and, as necessary, seek professional advice.

