By Todd Stankiewicz CMT, CFP, ChFC
1/ Palantir (PLTR) Surges, but is a Reversal Looming?
2/ Is This a Head Fake or the Start of a Bond Reversal?
3/ Filtering Out the Noise: Why the 10-Month Moving Average Matters
Investopedia is partnering with CMT Association on this newsletter. The contents of this newsletter are for informational and educational purposes only, however, and do not constitute investing advice. The guest authors, which may sell research to investors, and may trade or hold positions in securities mentioned herein do not represent the views of CMT Association or Investopedia. Please consult a financial advisor for investment recommendations and services.
1/
Palantir (PLTR) Surges, but is a Reversal Looming?

Palantir Technologies (PLTR) ripped higher this week after an earnings beat, sending the stock surging through the upper Bollinger Band to an overbought Relative Strength Index (RSI) reading.
Interestingly, this new all-time high is accompanied by a bearish RSI divergence, the stock price is making a higher high, but the RSI is making a lower high. This divergence is often a precursor to a potential pause or reversal.
The case for a pullback strengthens when looking at the monthly RSI print of 91.69, an extremely overbought level. Historically, when PLTR has reached similar conditions, it has struggled to sustain momentum. Based on the last two occurrences of this setup, it may be time to consider taking some profits and looking for better risk-reward opportunities elsewhere
2/
Is This a Head Fake or the Start of a Bond Reversal?
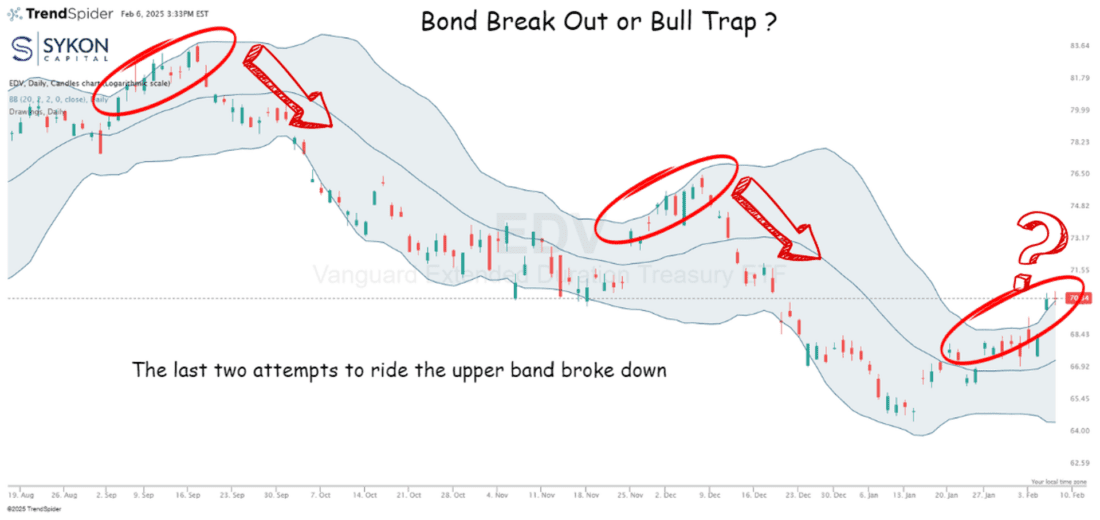
Over the past six months, the Vanguard Extended Duration Treasury ETF (EDV) has broken above its upper Bollinger Band twice, attempting to reverse a five-year-long downtrend in bond prices. Now, for the third time, it’s trying again.
Is the third time the charm?
Can this breakout finally mark the turning point for long-duration bonds, or is it just another head fake before a deeper drawdown?
Key level to watch: $67.39, the middle Bollinger Band. If EDV can hold above this level, it could signal a more sustainable move. However, a break below may indicate yet another failed attempt, similar to the previous two instances.
3/
Filtering Out the Noise: Why the 10-Month Moving Average Matters
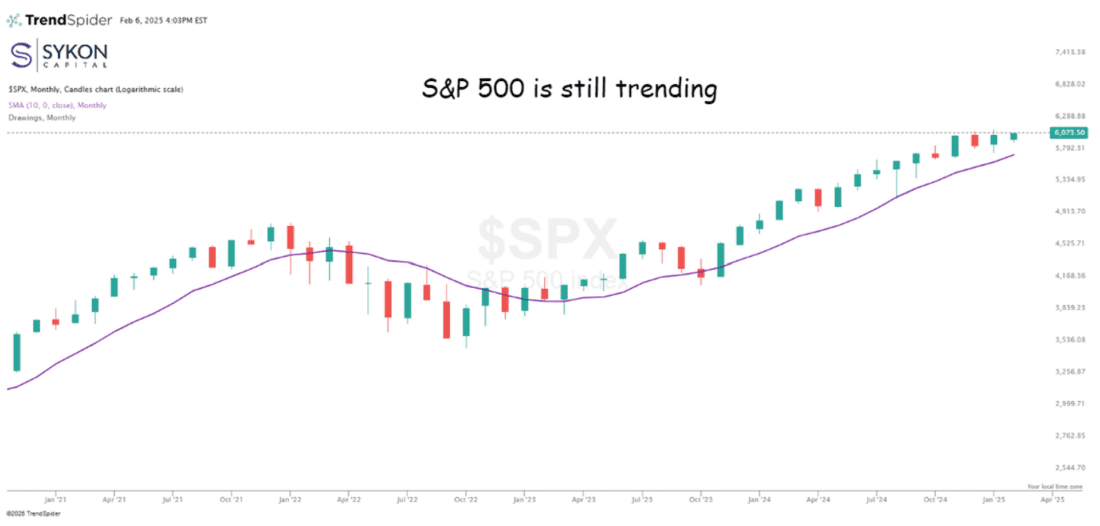
The S&P 500 is still above its 10-month moving average, a simple yet effective way to cut through the noise of daily headlines and economic data. Over the past two weeks, it has been easy to get caught up in market narratives, but at the end of each week, I come back to this chart, one of my favorites.
Historically, when the index breaks below this level, downside risk increases, just as we saw in 2022. While I’m not an advocate of a strict buy-and-hold approach, I do believe in filtering out the noise and focusing on meaningful signals. The 10-month moving average is one of those signals worth watching.
Good luck out there.
Disclaimer: Advisory Services offered through Sykon Capital, LLC, a registered investment advisor with the U.S. Securities and Exchange Commission. This material is intended for informational purposes only. It should not be construed as legal or tax advice and is not intended to replace the advice of a qualified attorney or tax advisor. The information contained in this presentation has been compiled from third party sources and is believed to be reliable as of the date of this report. Past performance is not indicative of future returns and diversification neither assures a profit nor guarantees against loss in a declining market. Investments involve risk and are not guaranteed.
—
Originally posted 07th February 2025
Disclosure: Investopedia
Investopedia.com: The comments, opinions and analyses expressed herein are for informational purposes only and should not be considered individual investment advice or recommendations to invest in any security or to adopt any investment strategy. While we believe the information provided herein is reliable, we do not warrant its accuracy or completeness. The views and strategies described on our content may not be suitable for all investors. Because market and economic conditions are subject to rapid change, all comments, opinions and analyses contained within our content are rendered as of the date of the posting and may change without notice. The material is not intended as a complete analysis of every material fact regarding any country, region, market, industry, investment or strategy. This information is intended for US residents only.
Disclosure: Interactive Brokers
Information posted on IBKR Campus that is provided by third-parties does NOT constitute a recommendation that you should contract for the services of that third party. Third-party participants who contribute to IBKR Campus are independent of Interactive Brokers and Interactive Brokers does not make any representations or warranties concerning the services offered, their past or future performance, or the accuracy of the information provided by the third party. Past performance is no guarantee of future results.
This material is from Investopedia and is being posted with its permission. The views expressed in this material are solely those of the author and/or Investopedia and Interactive Brokers is not endorsing or recommending any investment or trading discussed in the material. This material is not and should not be construed as an offer to buy or sell any security. It should not be construed as research or investment advice or a recommendation to buy, sell or hold any security or commodity. This material does not and is not intended to take into account the particular financial conditions, investment objectives or requirements of individual customers. Before acting on this material, you should consider whether it is suitable for your particular circumstances and, as necessary, seek professional advice.
Disclosure: ETFs
Any discussion or mention of an ETF is not to be construed as recommendation, promotion or solicitation. All investors should review and consider associated investment risks, charges and expenses of the investment company or fund prior to investing. Before acting on this material, you should consider whether it is suitable for your particular circumstances and, as necessary, seek professional advice.
