Enthusiasm about artificial intelligence gets a stern test this afternoon when two of the more prominent beneficiaries of AI-mania – Microsoft (MSFT) and Alphabet (GOOG, GOOGL) — report earnings after the close.
MSFT, which for years seemed like a plodding behemoth, has benefitted from its linkage with OpenAI to recapture its place as largest company by market capitalization. GOOGL lagged MSFT’s performance when the latter company’s AI investment came to the fore, but investors came to recognize that the search giant would be unlikely to cede its prominence without a significant challenge. Needless to say, both have earned their vaunted roles as members of the Magnificent Seven.
Considering that MSFT and the combination of GOOG + GOOGL respectively represent about 7.3% and 4.1% of the S&P 500 (SPX) and 9% and 5.3% of the NASDAQ 100 (NDX), it is clear that a significant move by one or both of these companies – in either direction – can have important impacts upon the broader markets. So, let’s take a look at what the options market is anticipating for each of these companies.
Starting with MSFT, the consensus EPS estimate is for $2.78 on revenues of $61.14 billion. That’s up from $2.32 four quarters ago. The company’s Azure cloud effort has taken a bit of a secondary role in investors’ minds to AI, but analysts will be watching closely to see how it is performing. Furthermore, it will be enlightening to hear how its integration of Activision is going.
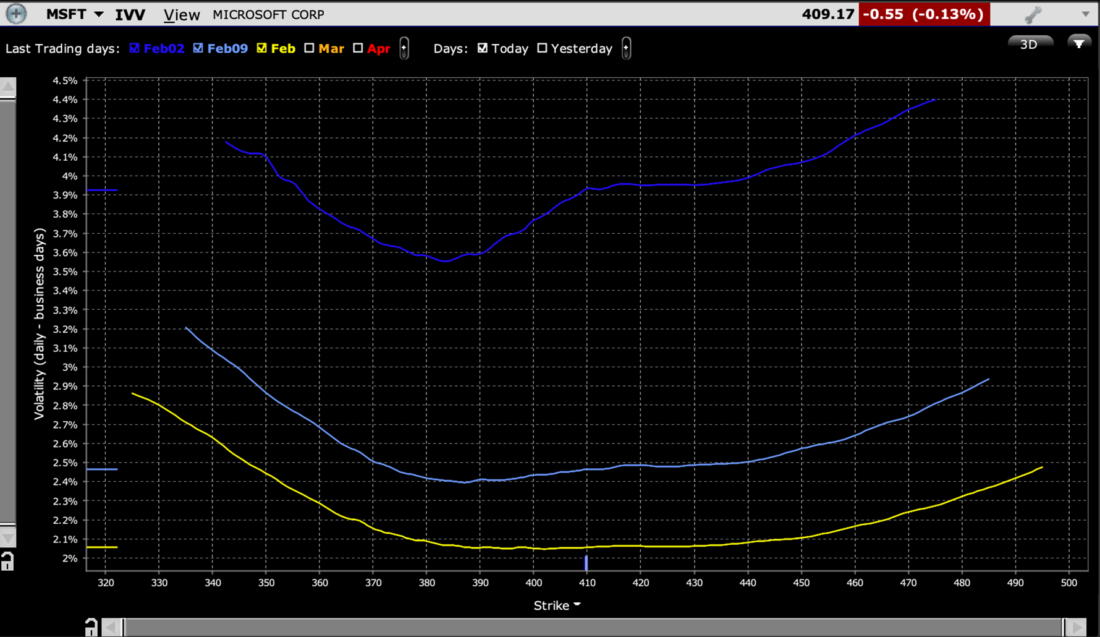
At-money options expiring Friday are trading with an implied daily volatility of 3.9%. This is broadly commensurate with MSFT’s recent post-earnings history, which showed moves of +3.1%, -3.8%, +7.2%, -0.6%, -7.7% and +6.7%. Yet the skew for these near-term options is unusual. Instead of a symmetrical skew between upside and downside volatilities, or the type of “Elvis smile” that shows risk aversion with relatively boosted downside strikes that is typical for many companies ahead of earnings, we have a notable trough in the $380-390 range.
MSFT Implied Volatilities by Strike for Options Expiring February 2nd (dark blue), February 9th (light blue), February 16th (yellow)
Source: Interactive Brokers
Past performance is not indicative of future results.
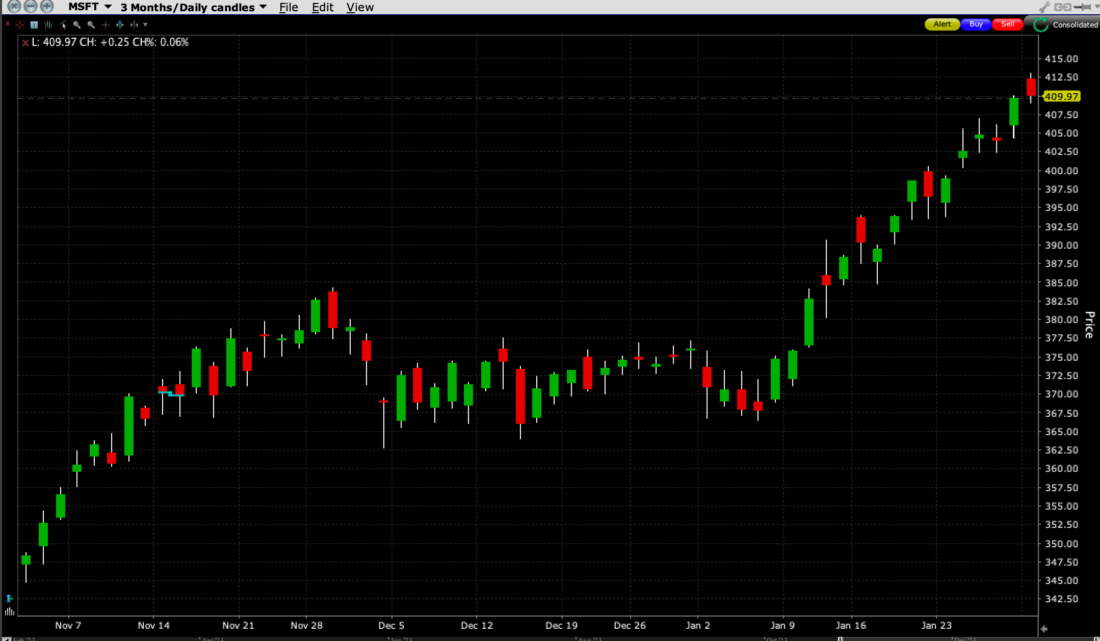
The skew in weekly options seems to assert that options traders are relatively unconcerned about the stock pulling back much below $380 and have far greater concern that the stock could rally by a similar amount. A glance at a price chart of MSFT shows that there could indeed be support at the $380 level – about 7% below current prices – but it is worth noting that the stock last traded at that level only two weeks ago. The recent momentum is phenomenal, but it also means that MSFT’s price action is quite extended.
MSFT 3-Month Daily Candles
Source: Interactive Brokers
Past performance is not indicative of future results.
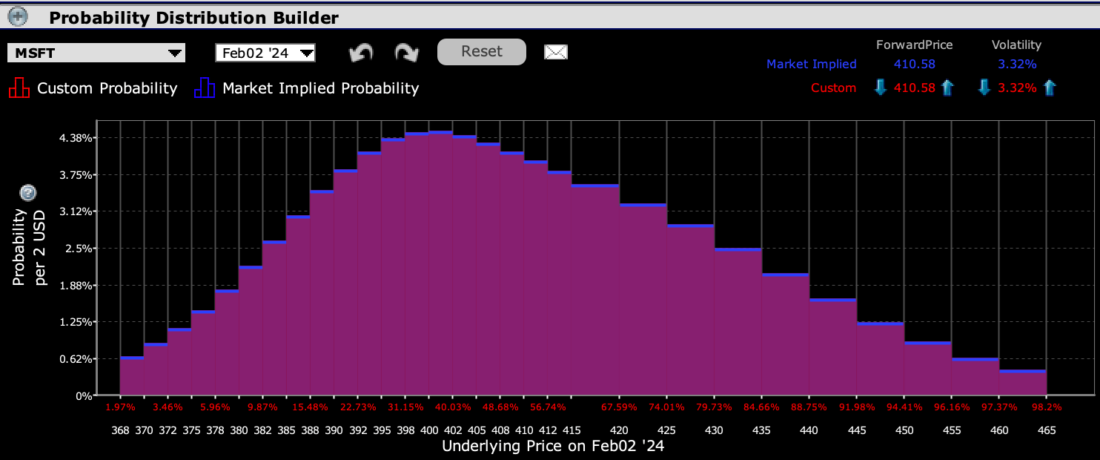
Considering the year-to-date pop in MSFT, it is thus not completely surprising that the IBKR Probability Lab shows a peak slightly below current levels in the $398-402 range. Yet the area under the curve is clearly greater to the upside than downside:
IBKR Probability Lab for MSFT Options Expiring February 2nd
Source: Interactive Brokers
Past performance is not indicative of future results.
Moving onto Alphabet, we see similar types of optimism. Expectations are for EPS of $1.72 on ex-TAC revenues of $70.97 billion, up sharply from $1.05 four quarters ago. As with MSFT, eyes will be focused on the Google cloud business, but the real money is still made from advertising on Google search and YouTube. It will be quite important to see whether Bing’s use of ChatGPT is cutting into Google’s dominant share.
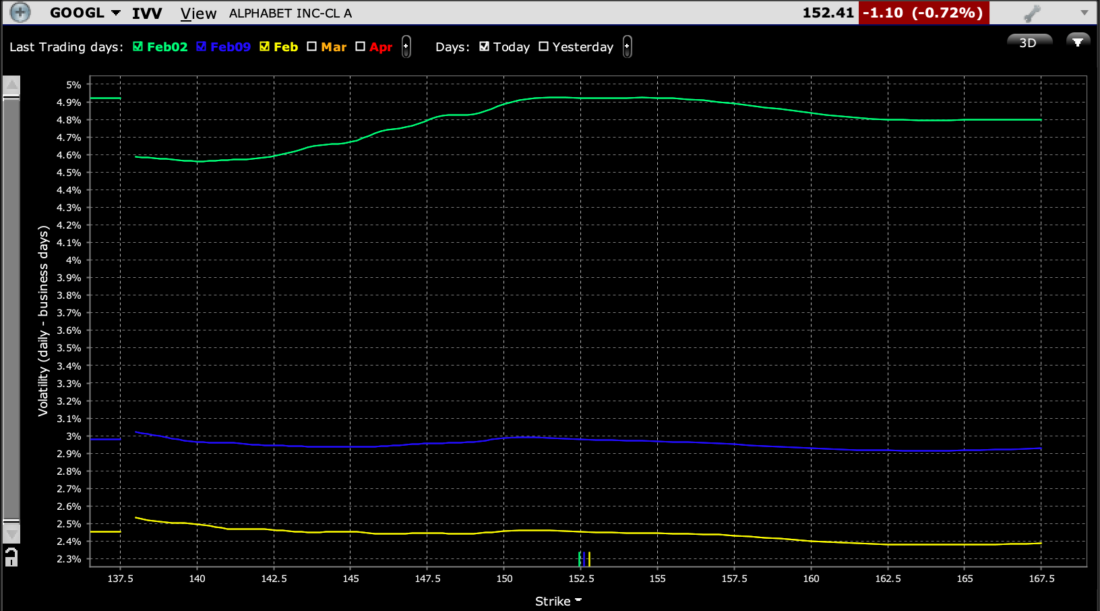
GOOGL is famously parlous with forward guidance, so it is not surprising to see front-week, at-money options trading with a daily implied volatility of 4.9%. Again, that is broadly consistent with the recent post-earnings moves of -9.5%, +5.8%, -0.1%, -2.8%, -9.1%, and 7.7%. But as with MSFT, the skews are rather bizarre. In this case they are pancake-flat, with a slight hump in at-money options:
GOOGL Implied Volatilities by Strike for Options Expiring February 2nd (dark blue), February 9th (light blue), February 16th (yellow)
Source: Interactive Brokers
Past performance is not indicative of future results.
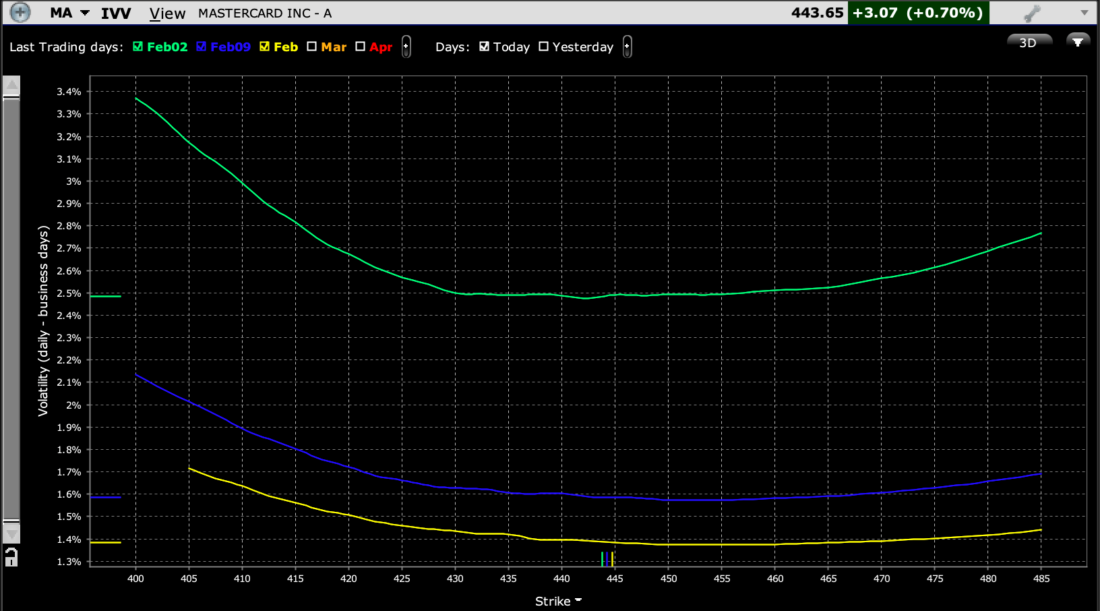
When I note that the skews for MSFT and GOOGL are unusual, compare them to those of Mastercard (MA), which is scheduled to report tomorrow. These are typical for large companies about to report:
MSFT Implied Volatilities by Strike for Options Expiring February 2nd (dark blue), February 9th (light blue), February 16th (yellow)
Source: Interactive Brokers
Past performance is not indicative of future results.
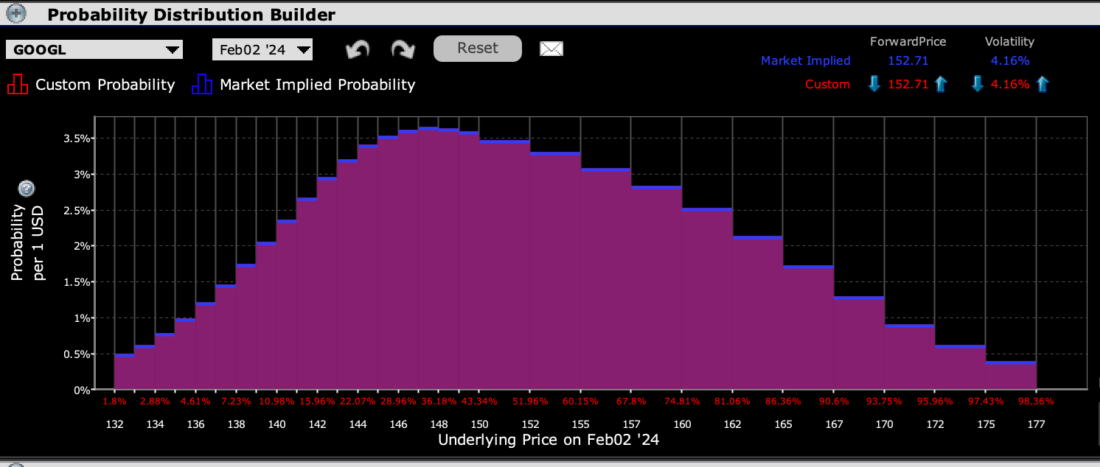
As with MSFT, the IBKR Probability Lab for front-week GOOGL options shows a peak slightly below current levels, but with far more area under the upside portion of the curve:
IBKR Probability Lab for GOOGL Options Expiring February 2nd
Source: Interactive Brokers
Past performance is not indicative of future results.
It is very hard to bet against companies that have demonstrated such phenomenal recent momentum. MSFT is up 70% and GOOGL is up 57% in the past year, and both stocks are up almost 10% in the year, er, month-to-date. But that type of recent performance implies that lofty expectations must be built into those stock prices. It brings me back to the days of the “whisper numbers”, when there were quiet expectations that were usually above the published estimates. It would not at all be shocking if in-line, or even modest beats, are not already priced in.
President Franklin Delano Roosevelt famously said, “the only thing we have to fear is fear itself.” After a career in options trading and risk management, I prefer to paraphrase FDR by saying, “the only thing we have to fear is the lack of fear itself.” I have to question if that is the situation for the megacap tech leaders right now. We’ll find out much more this afternoon and again on Thursday after Apple (AAPL), Amazon (AMZN) and Meta Platforms (META) report almost simultaneously, (Nvidia, the AI poster child is three weeks away.)
Disclosure: Interactive Brokers
The analysis in this material is provided for information only and is not and should not be construed as an offer to sell or the solicitation of an offer to buy any security. To the extent that this material discusses general market activity, industry or sector trends or other broad-based economic or political conditions, it should not be construed as research or investment advice. To the extent that it includes references to specific securities, commodities, currencies, or other instruments, those references do not constitute a recommendation by IBKR to buy, sell or hold such investments. This material does not and is not intended to take into account the particular financial conditions, investment objectives or requirements of individual customers. Before acting on this material, you should consider whether it is suitable for your particular circumstances and, as necessary, seek professional advice.
The views and opinions expressed herein are those of the author and do not necessarily reflect the views of Interactive Brokers, its affiliates, or its employees.
Disclosure: Probability Lab
The projections or other information generated by the Probability Lab tool regarding the likelihood of various investment outcomes are hypothetical in nature, do not reflect actual investment results and are not guarantees of future results. Please note that results may vary with use of the tool over time.
Disclosure: Options Trading
Options involve risk and are not suitable for all investors. Multiple leg strategies, including spreads, will incur multiple commission charges. For more information read the “Characteristics and Risks of Standardized Options” also known as the options disclosure document (ODD) or visit ibkr.com/occ

