Candlestick patterns are visual representations in the chart form that play a key role in trading strategies. These patterns are easy to read as their formation is simple. For creating a trading strategy with candlestick patterns, you need to know the concepts such as what the candlestick patterns are, how they are formed, their types, their working etc.
You can learn all about the above mentioned concepts with this blog that covers the candlestick patterns in detail.
This blog covers:
- What are candlesticks?
- Anatomy of candlesticks
- History of candlesticks
- Candlestick charts vs line charts
- What are candlestick patterns?
- Categories of candlestick patterns
- Types of candlestick patterns
- How to read different candlestick patterns?
- Benefits of reading candlestick patterns for trading
- Drawbacks of reading candlestick patterns for trading
- How to overcome the drawbacks related to candlestick patterns trading?
- Frequently Asked Questions about Candlestick patterns
What are candlesticks?
Candlesticks are used in trading to represent the Open, High, Low, and Close (OHLC) price movements of the tradable instrument (security, derivative, currency etc.). Candlesticks resemble the shape of a real-life candlestick and hence, the name.
You can see the OHLC prices in the image below with the help of candlestick formation. These prices indicate three situations in the market or of a financial instrument.
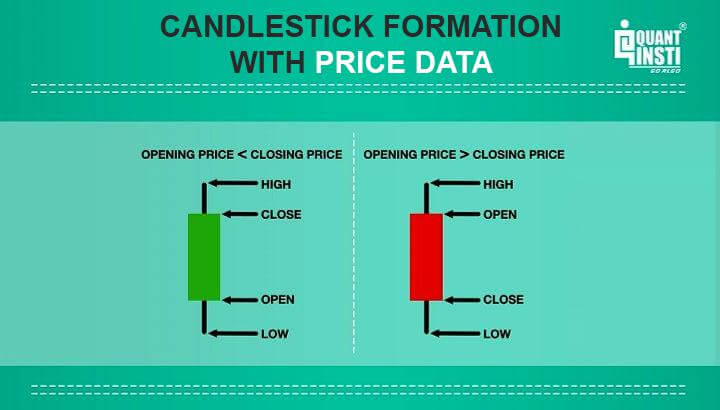
There are two types of candlesticks indicating the trend of the market or an instrument. These two types are:
- White Candlesticks or Green Candlesticks: Indicate an uptrend
- Black Candlesticks or Red Candlesticks: Indicate a downtrend
Candlesticks have various sizes, shapes and even colours to portray different prices. Since the prices keep varying, the size and shape of the candlesticks also vary.
These various shapes and sizes can be highly effective in helping you predict the future market direction since they can point towards the formation of a trend or anticipation of a trend reversal.
See this QuantInsti short video to learn all about candlesticks.
Let us learn more about candlesticks by seeing the anatomy of the same which will help you with the information regarding what each part of the candlestick represents.
Anatomy of candlesticks
The anatomy of the Candlesticks has stayed almost similar throughout the ages to give us the current shape and meaning. It consists of 4 distinct values namely:
- The opening price,
- Closing price,
- The highest price for a given interval, and
- The lowest price for a given interval.
It is like a combination of a line chart and a bar chart, where each bar represents all four important pieces of information for an interval.

In the image above, the thin vertical lines above and below the body are called the wicks or shadows which represent the high and low prices of the trading session.
Ahead in the blog, let us find out about how candlesticks came about and more about their interesting history.
History of candlesticks
Candlesticks were developed in the 17th century in Japan. This is the reason why they are also known as Japanese candlesticks.
After they were developed, locals in Japan began using candlesticks while trading rice. This idea was gradually adopted by various people and across countries and kept evolving for the better. The evolution of the same led to what the candlesticks are at present.
Japanese Candlesticks are thought to have been introduced to the West in the book, ‘Japanese Candlestick Charting Techniques by Steve Nison. The West developed the bar point and figure analysis almost 100 years later.
In ancient Japan, the principles were applicable to Rice and today they are applicable to stocks.
Munehisa Homma, a renowned rice merchant from the Japanese town of Sakata, traded in the Dojima market in the 1700s. Further study of candlesticks mentions ‘Sakata’s Methods’ or ‘Sakata’s Rules’, which are based on the name of this particular market.
Homma is said to have developed candlestick charts during his lifetime by studying years of historical data and comparing them with weather conditions. This study also helped him understand the role of emotions in the value and pricing behind the trade of rice.
Stay tuned for Part II to learn about candlestick patterns.
Originally posted on QuantInsti blog.
Disclosure: Interactive Brokers
Information posted on IBKR Campus that is provided by third-parties does NOT constitute a recommendation that you should contract for the services of that third party. Third-party participants who contribute to IBKR Campus are independent of Interactive Brokers and Interactive Brokers does not make any representations or warranties concerning the services offered, their past or future performance, or the accuracy of the information provided by the third party. Past performance is no guarantee of future results.
This material is from QuantInsti and is being posted with its permission. The views expressed in this material are solely those of the author and/or QuantInsti and Interactive Brokers is not endorsing or recommending any investment or trading discussed in the material. This material is not and should not be construed as an offer to buy or sell any security. It should not be construed as research or investment advice or a recommendation to buy, sell or hold any security or commodity. This material does not and is not intended to take into account the particular financial conditions, investment objectives or requirements of individual customers. Before acting on this material, you should consider whether it is suitable for your particular circumstances and, as necessary, seek professional advice.
