From SIA Charts
1/ Amazon.com Inc. (AMZN)
2/ AMZN vs MAGS
3/ Point and Figure Chart
Investopedia is partnering with CMT Association on this newsletter. The contents of this newsletter are for informational and educational purposes only, however, and do not constitute investing advice. The guest authors, which may sell research to investors, and may trade or hold positions in securities mentioned herein do not represent the views of CMT Association or Investopedia. Please consult a financial advisor for investment recommendations and services.
1/
Amazon.com Inc. (AMZN)

Courtesy of SIA Charts
Amazon.com, Inc. (AMZN) is a multinational technology company that operates in e-commerce, cloud computing, online advertising, digital streaming, and artificial intelligence. It is considered one of the Magnificent 7 companies, and, as with the Apple report last week, this analysis will focus on Amazon’s performance relative to various benchmarks, including the broad S&P 100 and NASDAQ 100 indexes, the Roundhill Magnificent Seven ETF (MAGS), and other asset classes using SIA SMAX comparisons. The first table displays a relative strength matrix comparing the seven mega-cap stocks, along with the Roundhill Magnificent Seven ETF (MAGS), iShares S&P 100 ETF (OEF), and Invesco NASDAQ Trust (QQQ). Looking at the top of the list, NVIDIA continues to lead the group with a remarkable 187% year-to-date gain, while Tesla follows with a 29% YTD return. Although Tesla slipped early in 2024, a 46% rally in the past quarter has lifted shares to the #2 spot in the SIA Custom Mega Cap Matrix. Amazon ranks #6 with a 33% performance over the past year, still underperforming the Roundhill Magnificent Seven ETF’s 51% return. However, Amazon has closed this gap with a 3-month performance of 14.09%, outpacing the MAGS ETF by 163 basis points (12.46%). The 1-month performance was nearly in line with the MAGS 7 average of just over 7%. This comparison becomes even more striking when considering the performance of the iShares S&P 100 ETF and Invesco QQQ Trust, which returned 1.47% and 1.17%, respectively, over the past month, or the YTD numbers of 28.01% and 21.79%. Analyzing performance from various angles, it becomes evident that Amazon is showing strong recent momentum, and when considering the rise in the SIA relative strength matrix, it is possible Amazon could be positioning itself to become a relative strength leader within the Magnificent Seven once again, as it did in 2023.
2/
AMZN vs MAGS
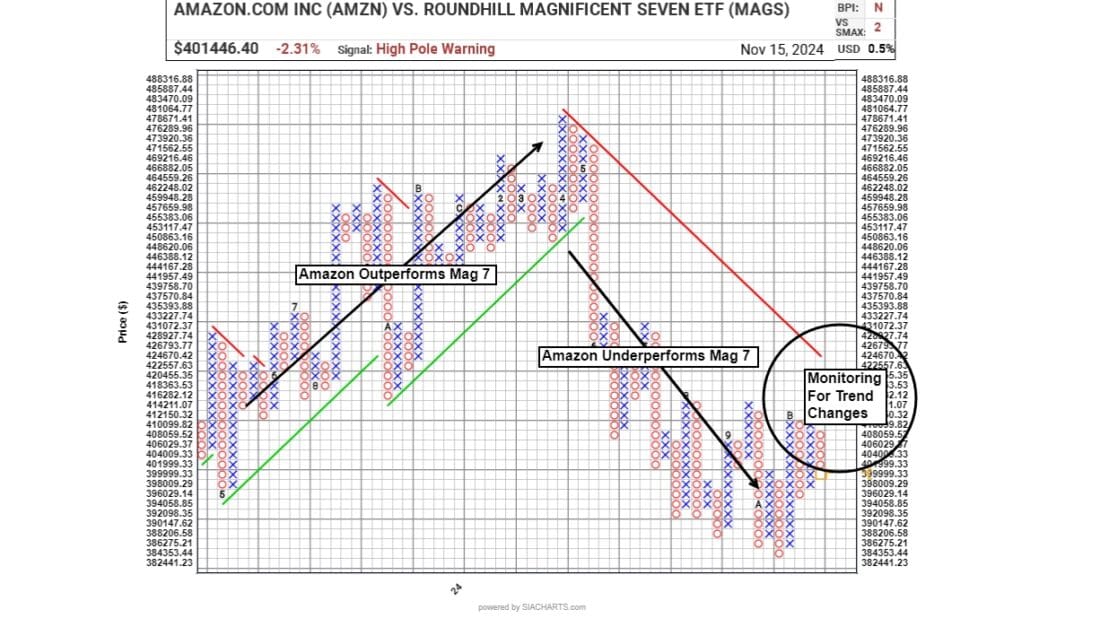
Next, the first point-and-figure (P&F) chart compares Amazon’s performance to that of the Roundhill Magnificent Seven ETF (MAGS) over the past 18 months. Amazon outperformed MAGS for much of 2023 but only began to underperform again in May 2024. While Amazon continues to underperform on the P&F chart, it is showing signs of sideways consolidation and will be watched for any reversal, spread double tops, or a move through the red negative trend line.

Courtesy of SIA Charts
3/
Point and Figure Chart
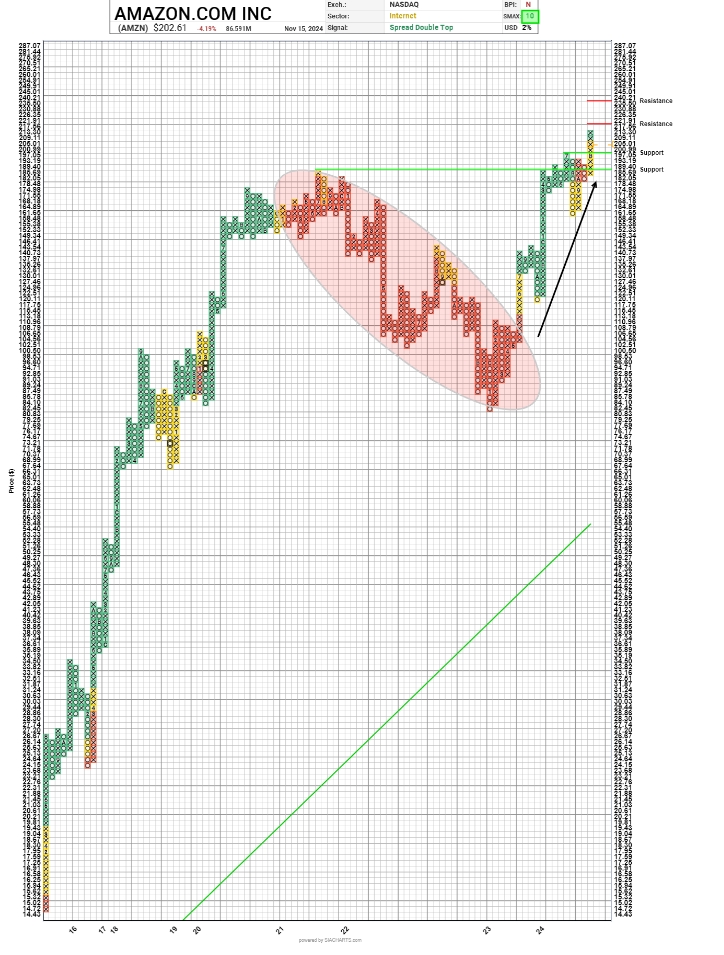
In the second point-and-figure chart, the SIA matrix position overlay tool is used to color code Amazon’s performance within the SIA S&P 100 Index Report. The underperformance period is highlighted by the red oval, where Amazon’s price corrected from $180 to as low as $80 before buyers regained control. Shares quickly rebounded, moving into the yellow zone, then green, with brief periods of correction. Now, shares have broken through to new all-time highs, surpassing the psychological $200 barrier. Support levels are at $197.05 and $185.69, while resistance can be projected at $221.91 and $240.21, based on vertical counts of prior trading ranges and breakouts. The SMAX score, which compares Amazon to other asset classes, solidifies Amazon’s outperformance characteristics with a perfect 10/10 score.

Courtesy of SIA Charts
—
Originally posted 19th November 2024
Disclosure: Investopedia
Investopedia.com: The comments, opinions and analyses expressed herein are for informational purposes only and should not be considered individual investment advice or recommendations to invest in any security or to adopt any investment strategy. While we believe the information provided herein is reliable, we do not warrant its accuracy or completeness. The views and strategies described on our content may not be suitable for all investors. Because market and economic conditions are subject to rapid change, all comments, opinions and analyses contained within our content are rendered as of the date of the posting and may change without notice. The material is not intended as a complete analysis of every material fact regarding any country, region, market, industry, investment or strategy. This information is intended for US residents only.
Disclosure: Interactive Brokers
Information posted on IBKR Campus that is provided by third-parties does NOT constitute a recommendation that you should contract for the services of that third party. Third-party participants who contribute to IBKR Campus are independent of Interactive Brokers and Interactive Brokers does not make any representations or warranties concerning the services offered, their past or future performance, or the accuracy of the information provided by the third party. Past performance is no guarantee of future results.
This material is from Investopedia and is being posted with its permission. The views expressed in this material are solely those of the author and/or Investopedia and Interactive Brokers is not endorsing or recommending any investment or trading discussed in the material. This material is not and should not be construed as an offer to buy or sell any security. It should not be construed as research or investment advice or a recommendation to buy, sell or hold any security or commodity. This material does not and is not intended to take into account the particular financial conditions, investment objectives or requirements of individual customers. Before acting on this material, you should consider whether it is suitable for your particular circumstances and, as necessary, seek professional advice.
Disclosure: ETFs
Any discussion or mention of an ETF is not to be construed as recommendation, promotion or solicitation. All investors should review and consider associated investment risks, charges and expenses of the investment company or fund prior to investing. Before acting on this material, you should consider whether it is suitable for your particular circumstances and, as necessary, seek professional advice.

