From SIA Charts
1/ Nvidia Corp. (NVDA)
2/ Matrix
3/ Candlestick Chart
Investopedia is partnering with CMT Association on this newsletter. The contents of this newsletter are for informational and educational purposes only, however, and do not constitute investing advice. The guest authors, which may sell research to investors, and may trade or hold positions in securities mentioned herein do not represent the views of CMT Association or Investopedia. Please consult a financial advisor for investment recommendations and services.
1/
Nvidia Corp. (NVDA)

Courtesy of SIA Charts
Continuing the analysis of the “magnificent seven” stocks, today’s focus is on Nvidia Corp. (NVDA), a dominant player in the market with a year-to-date return of 183%, far surpassing the iShares S&P 100 ETF (OEF) return of 28.5% and the Invesco NASDAQ Trust (QQQ) return of 22.6%. However, despite this impressive performance, the semiconductor sector has faced challenges in the past quarter, with many stocks in the sector experiencing significant declines as seen in the attached SIA sector report. The hallmark of the SIA platform is its ability to measure risk, which is accomplished through multiple methods. The primary indicator is relative strength, calculated daily by comparing asset classes, sectors, and 80,000 investments across hundreds of reports. Additionally, the SIA platform provides valuable bullish percent data, which, when combined with relative strength readings, offers a comprehensive understanding of market risk. This data-driven approach enables skilled operators to manage risk effectively, much like a farmer uses multiple data points to manage crop risks. Investors can use this same data to potentially protect portfolios.
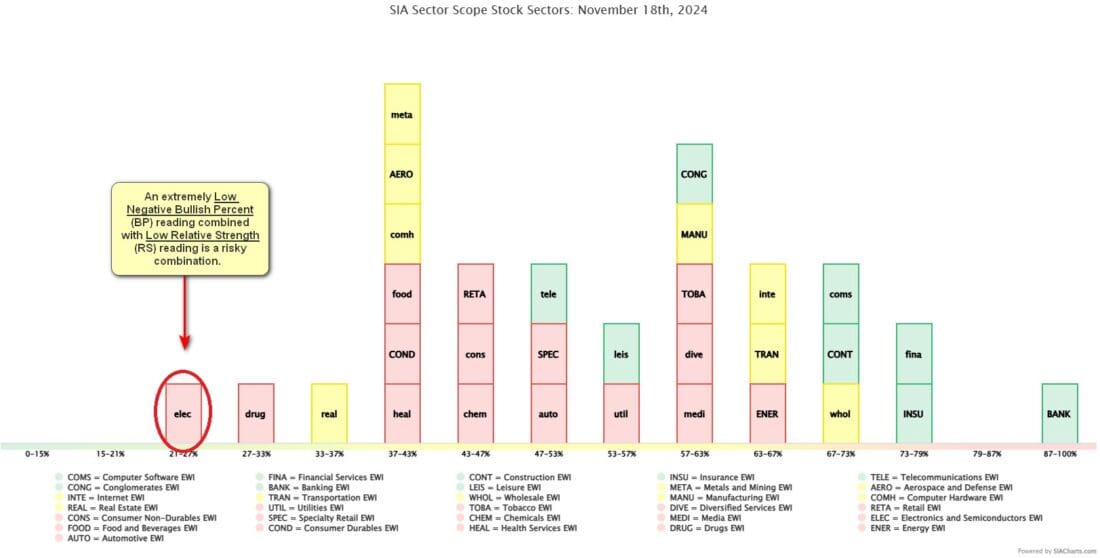
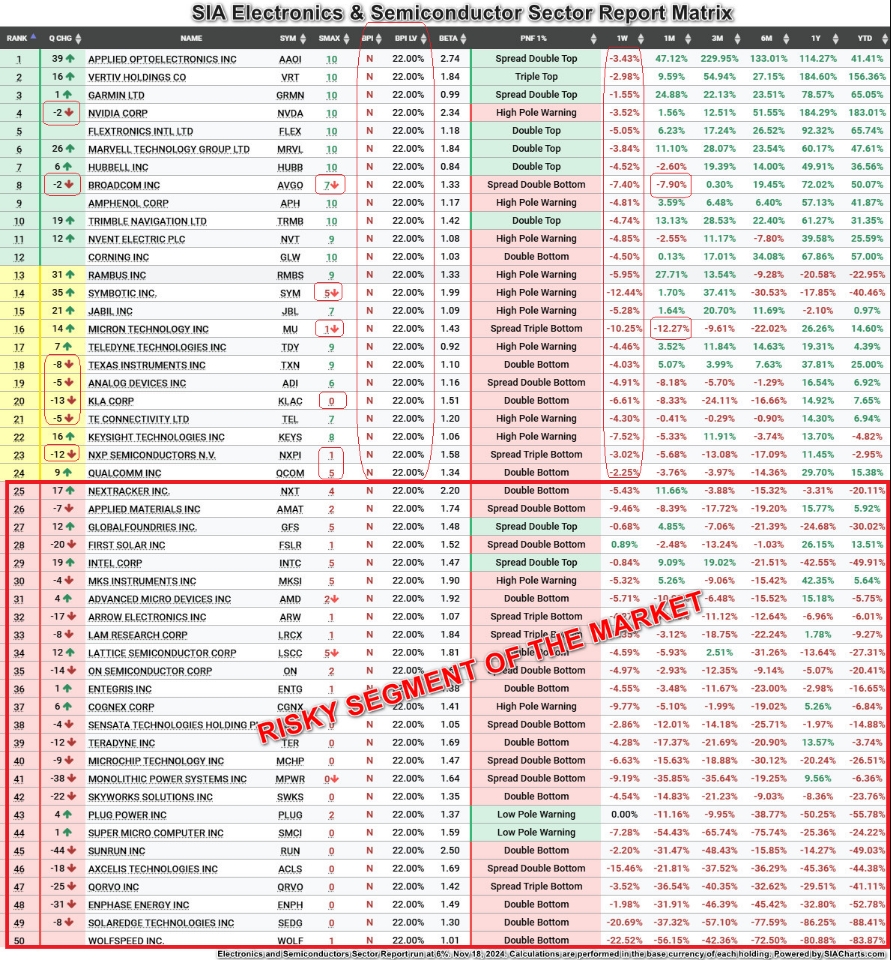
Turning to the semiconductor sector, it is essential to evaluate its risk profile ahead of Nvidia’s upcoming earnings report tomorrow. The following facts are presented without speculation. First, the electronic and semiconductor sectors have lost relative strength and are currently positioned in the “Unfavored Zone” of the SIA sector report, which is a critical metric. Second, the sector’s bullish percent reading is just 22%, meaning the remaining 78% of stocks are on 1% point and figure chart (pnf) sell signals, including Nvidia, which has a point and figure high pole warning chart signal. To further illustrate this, the pnf 1% chart pattern for the sector reveals a concerning trend. Of the 50 names examined, only 10 are showing bullish patterns (22%), a number that continues to decline. This is a potential bearish signal. The attached bell curve further highlights this, with a bullish percent level of 22% marking the negative reading for the sector, along with red color representing the Unfavored relative strength ranking of the sector. For those focused on improving risk management, this represents a textbook case of potential high risk (see red circle). On the other hand, looking at the other side of the bell curve, the banking sector (BANK) shows the opposite trend: high relative strength and a strong bullish percent, continuing to move higher.
2/
Matrix

Courtesy of SIA Charts
Focusing on the semiconductor sector’s internal structure, the red box at the bottom of the matrix highlights the highest-risk names in the market. Any stocks within this area are considered the worst relative strength performers, with some showing disastrous absolute returns. However, stocks in the yellow and green zones could be viewed as the “best of the worst.” Names like Nvidia, Broadcom, KLA, and Micron Technologies fall into this category. While it may not be a popular opinion, these are the facts. Nvidia, positioned at the top of the SIA Nasdaq 100 Index Report and SIA S&P 100 Index Report relative strength matrices, is essentially a “lone wolf” within the semiconductor sector, which introduces potential additional risk.
3/
Candlestick Chart
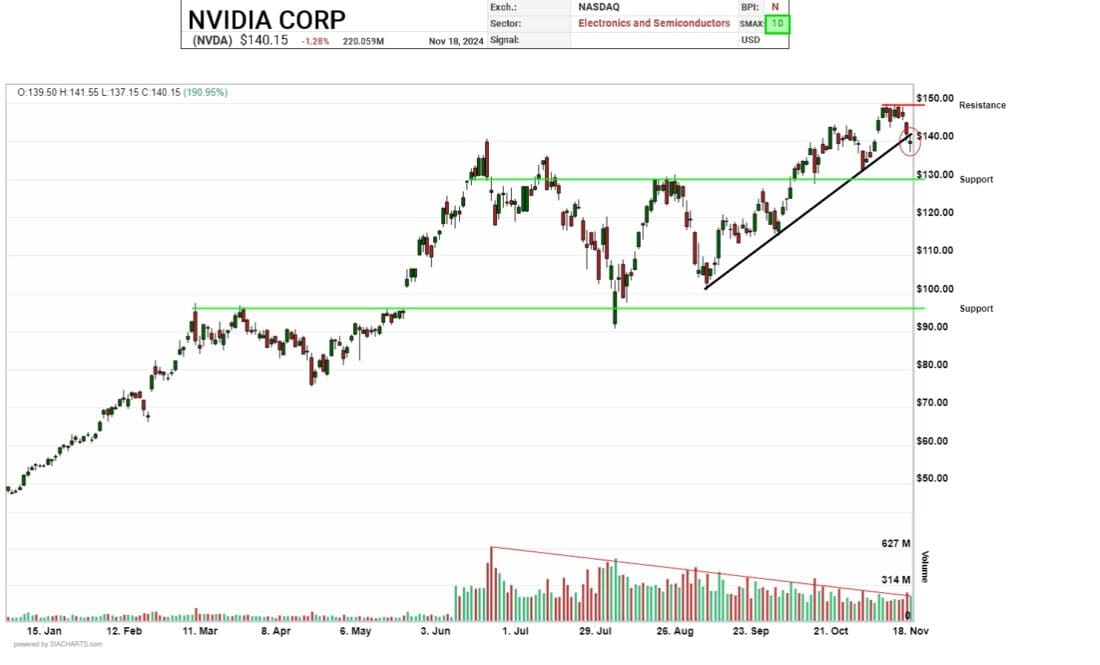
Turning to a short-term view via a candlestick chart, NVDA shares are encountering resistance around the $150 level and have shown signs of a breakdown from the recovery rally that began in August. Following a volatile summer, where shares traded erratically, the stock has been moving lower with steadily declining volume. While the sector overall has experienced falling SMAX readings, Nvidia continues to maintain a near-term perfect 10/10 score, signaling outperformance relative to other asset classes such as bonds, cash, and commodities. However, resistance remains significant at both the $140 and $150 levels. A breakout above these points would require re-evaluation for potential technical upside. On the downside, initial support is at $130, with limited support below that level extending all the way down to $90. However, the psychological $100 level is also notable.
In conclusion, while Nvidia remains technically strong within the SIA Index Reports, the risk/reward parameters of the sector could suggest significantly weak risk/reward parameters where elite advisors may need to manage these high-risk readings.

Courtesy of SIA Charts
—
Originally posted 20th November 2024
Disclosure: Investopedia
Investopedia.com: The comments, opinions and analyses expressed herein are for informational purposes only and should not be considered individual investment advice or recommendations to invest in any security or to adopt any investment strategy. While we believe the information provided herein is reliable, we do not warrant its accuracy or completeness. The views and strategies described on our content may not be suitable for all investors. Because market and economic conditions are subject to rapid change, all comments, opinions and analyses contained within our content are rendered as of the date of the posting and may change without notice. The material is not intended as a complete analysis of every material fact regarding any country, region, market, industry, investment or strategy. This information is intended for US residents only.
Disclosure: Interactive Brokers
Information posted on IBKR Campus that is provided by third-parties does NOT constitute a recommendation that you should contract for the services of that third party. Third-party participants who contribute to IBKR Campus are independent of Interactive Brokers and Interactive Brokers does not make any representations or warranties concerning the services offered, their past or future performance, or the accuracy of the information provided by the third party. Past performance is no guarantee of future results.
This material is from Investopedia and is being posted with its permission. The views expressed in this material are solely those of the author and/or Investopedia and Interactive Brokers is not endorsing or recommending any investment or trading discussed in the material. This material is not and should not be construed as an offer to buy or sell any security. It should not be construed as research or investment advice or a recommendation to buy, sell or hold any security or commodity. This material does not and is not intended to take into account the particular financial conditions, investment objectives or requirements of individual customers. Before acting on this material, you should consider whether it is suitable for your particular circumstances and, as necessary, seek professional advice.
Disclosure: ETFs
Any discussion or mention of an ETF is not to be construed as recommendation, promotion or solicitation. All investors should review and consider associated investment risks, charges and expenses of the investment company or fund prior to investing. Before acting on this material, you should consider whether it is suitable for your particular circumstances and, as necessary, seek professional advice.

