From SIA Charts
1/ Starbucks Corp. (SBUX) & Chipotle Mexican Grill Inc. (CMG)
2/ Starbucks Corp. (SBUX) Candlestick Chart
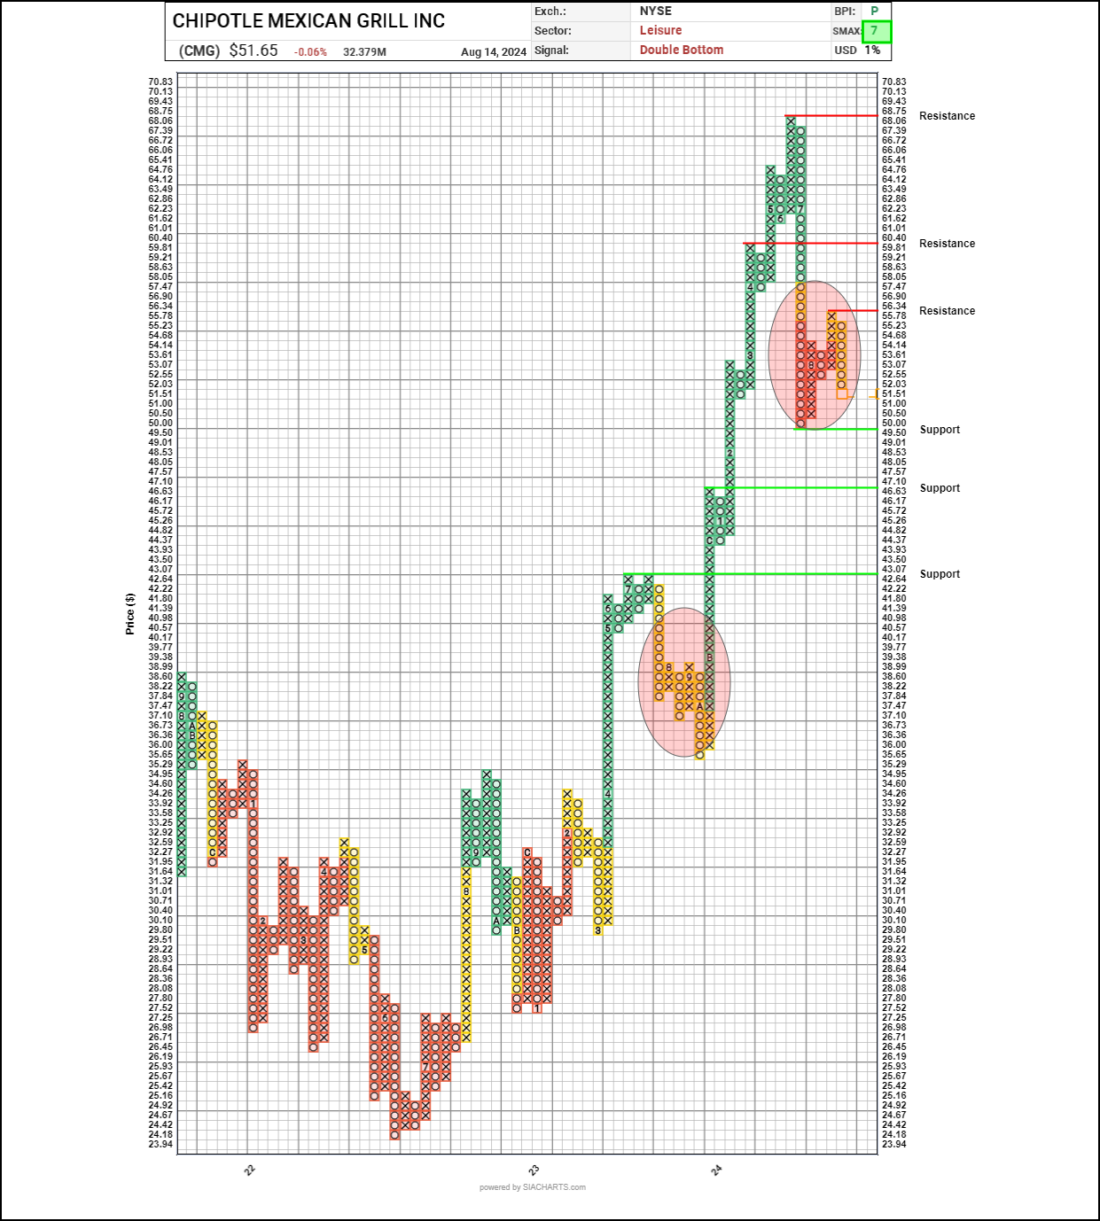
3/ Chipotle Mexican Grill Inc. (CMG) Point and Figure Chart
Investopedia is partnering with CMT Association on this newsletter. The contents of this newsletter are for informational and educational purposes only, however, and do not constitute investing advice. The guest authors, which may sell research to investors, and may trade or hold positions in securities mentioned herein do not represent the views of CMT Association or Investopedia. Please consult a financial advisor for investment recommendations and services.
1/
Starbucks Corp. (SBUX) & Chipotle Mexican Grill Inc. (CMG)

Courtesy of SIA Charts
Chipotle Mexican Grill’s (CMG) stock, with over 3,200 locations, continues to excel, reflecting its robust growth and operational success. In contrast, Starbucks (SBUX), which operates more than 37,000 stores, had been underperforming in the U.S. Consumer Services Sector until earlier this week. Starbucks’ stock surged from approximately $77 to $95 per share—a 24% increase—following the announcement of Brian Niccol as the new CEO. Niccol, the former CEO of Chipotle, is expected to drive positive changes at Starbucks, contributing to this recent boost. We’ll assess whether this turnaround is sustainable and also review the current status of Chipotle stock in this daily double stock report. Previously, on May 2, 2024, we noted Starbucks’ underperformance and its position at the bottom of our matrix reports, trading near the $70 level. The news of Niccol’s appointment led to a significant 25% stock jump, but the sustainability of this rise remains to be seen. According to our “relative strength” analysis, SBUX has moved into the Neutral Yellow Zone of the SIA S&P 500 Index Report. Historical data shows that while SBUX has occasionally reached the Favored Green Zone, it has lacked staying power. A sustained move into the top of the Favored Green Zone and consistent outperformance of the market and peers are necessary to confirm the turnaround.
2/
Candlestick Chart
Additionally, the candlestick chart reveals that SBUX has been confined within a long-term trading range for over five years. This range, supported by volume differentials, shows high trading volumes at $60-$70 and declining volumes as the stock approaches $100-$110. Currently trading at $93.90 after a sharp one-day rally, the risk/reward profile appears unfavorable. New investments should be considered near support levels as the new CEO honeymoon phase fades. A rise above $100, or ideally $110, would indicate a true turnaround, though it may take time.

Courtesy of SIA Charts
3/
Point and Figure Chart
Turning to Chipotle Mexican Grill Inc. (CMG), it has been a standout in the consumer services sector, with shares climbing from $35 in April 2023 to $68 over the past 18 months. The stock experienced two consolidation phases, one last summer and another this summer. The point-and-figure (P&F) chart shows a double bottom pattern in July, reflecting a period of distribution. Although CMG has recently bounced back into the Neutral Yellow Zone, technical resistance levels at $56.34, $60.40, and $68.75 are crucial. A break through these levels would confirm continued growth. Support levels are at $49.50, $46.63, and $42.64. Chipotle retains a bullish SMAX score of 7 out of 10, indicating strong short-term performance relative to other asset classes.

Courtesy of SIA Charts
—
Originally posted 16th August 2024
Disclosure: Investopedia
Investopedia.com: The comments, opinions and analyses expressed herein are for informational purposes only and should not be considered individual investment advice or recommendations to invest in any security or to adopt any investment strategy. While we believe the information provided herein is reliable, we do not warrant its accuracy or completeness. The views and strategies described on our content may not be suitable for all investors. Because market and economic conditions are subject to rapid change, all comments, opinions and analyses contained within our content are rendered as of the date of the posting and may change without notice. The material is not intended as a complete analysis of every material fact regarding any country, region, market, industry, investment or strategy. This information is intended for US residents only.
Disclosure: Interactive Brokers
Information posted on IBKR Campus that is provided by third-parties does NOT constitute a recommendation that you should contract for the services of that third party. Third-party participants who contribute to IBKR Campus are independent of Interactive Brokers and Interactive Brokers does not make any representations or warranties concerning the services offered, their past or future performance, or the accuracy of the information provided by the third party. Past performance is no guarantee of future results.
This material is from Investopedia and is being posted with its permission. The views expressed in this material are solely those of the author and/or Investopedia and Interactive Brokers is not endorsing or recommending any investment or trading discussed in the material. This material is not and should not be construed as an offer to buy or sell any security. It should not be construed as research or investment advice or a recommendation to buy, sell or hold any security or commodity. This material does not and is not intended to take into account the particular financial conditions, investment objectives or requirements of individual customers. Before acting on this material, you should consider whether it is suitable for your particular circumstances and, as necessary, seek professional advice.

