By David Cox, CMT, CFA, FCSI, FMA and Conor White CMT, CIM
1/ Electric Cars Are Our Future
2/ Argentina – It’s Time?
3/ 10-Year Yields
4/ S&P 500 – What’s the Breadth?
5/ U.S. Mid-Caps
Investopedia is partnering with CMT Association on this newsletter. The contents of this newsletter are for informational and educational purposes only, however, and do not constitute investing advice. The guest authors, which may sell research to investors, and may trade or hold positions in securities mentioned herein do not represent the views of CMT Association or Investopedia. Please consult a financial advisor for investment recommendations and services.
1/ Electric Cars Are Our Future
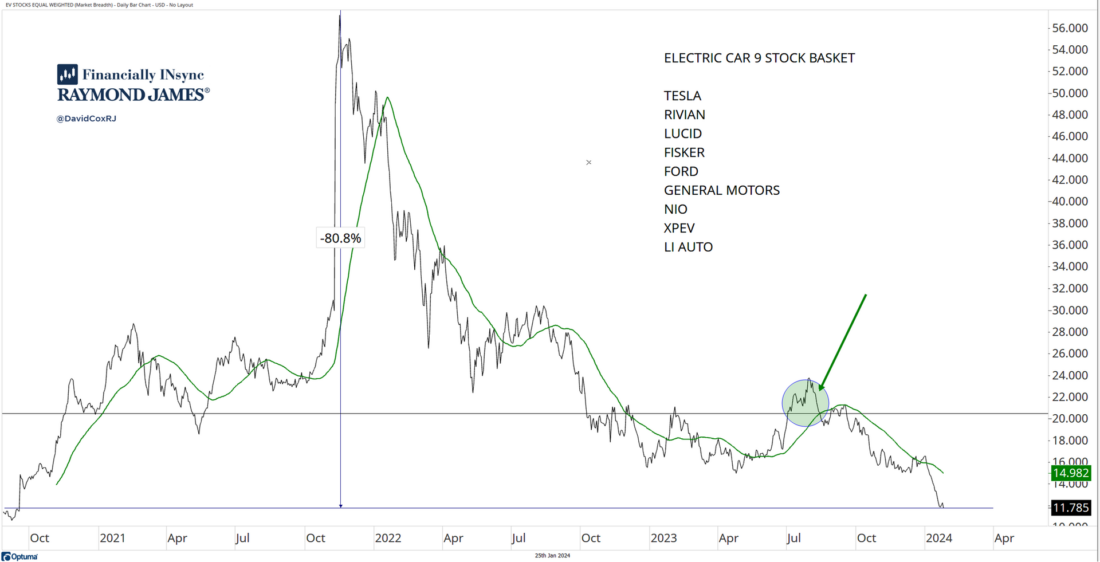
Although governments around the world are mandating (aka forcing) everyone to plan to buy electric cars, investors aren’t excited right now. A cursory read of the headlines (fundamentals) tells me that consumers aren’t buying the inventory and it’s been a cost hole for many manufacturers, especially big ones like Ford and General Motors. Here’s an equal weighted composite of nine stocks and it’s currently -80.8% below the 2021 highs and in a clear downtrend. Last summer, the group tried to move higher (green circle), but that move has since failed. Charts are charts, whether you like your electric car or not (or plan to get one), be careful and accept that great ideas don’t necessarily mean great investments.
2/ Argentina – It’s Time?
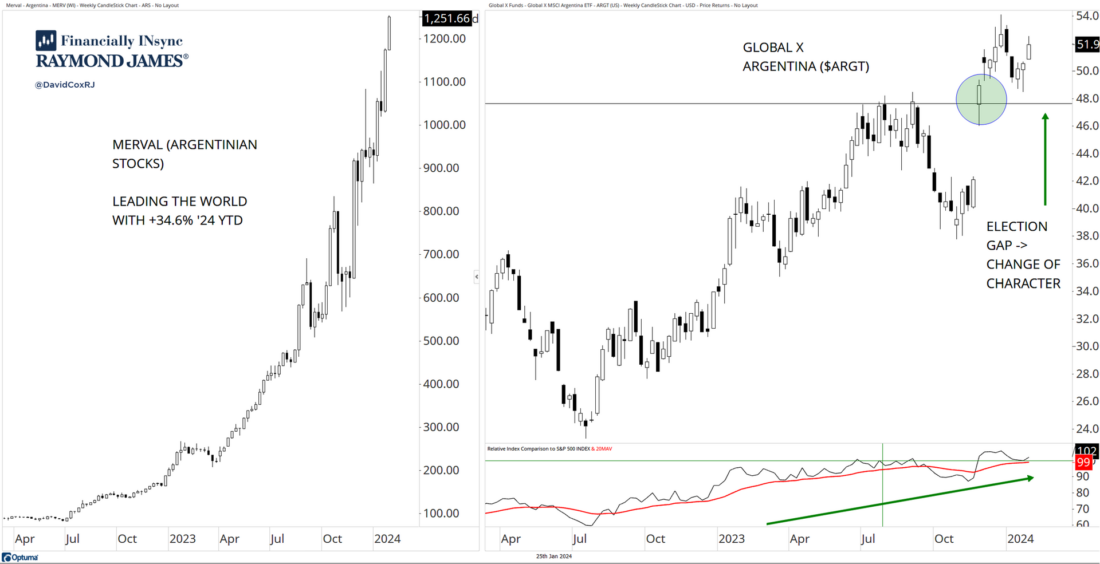
The Argentinian stock market has been soaring for years (+it’s 34.6% already YTD in ’24). An excellent example of the inflationary characteristics of stocks with the only way to combat soaring triple digit inflation is to own assets like stocks, although stocks aren’t on the balance sheets of many Argentinians (I suspect). This of course is the issue, whereby inflation, money printing and reckless government spending harm the low-middle class who is priced out of their life, while the wealthy benefit through asset price inflation (hint: this is happening in the U.S. and Canada too). Since the recent electoral change, currency and central bank plans are being changed and the Global X Argentina ($ARGT), the ETF available to U.S. investors, is sporting a different look. Certainly not the smooth and soaring ride that the local Merval stock market has been (left panel), but a post-election gap up and S&P 500 relative outperformance for the past year for $ARGT tells me we shouldn’t just scoff at what is happening.
3/ 10-Year Yields
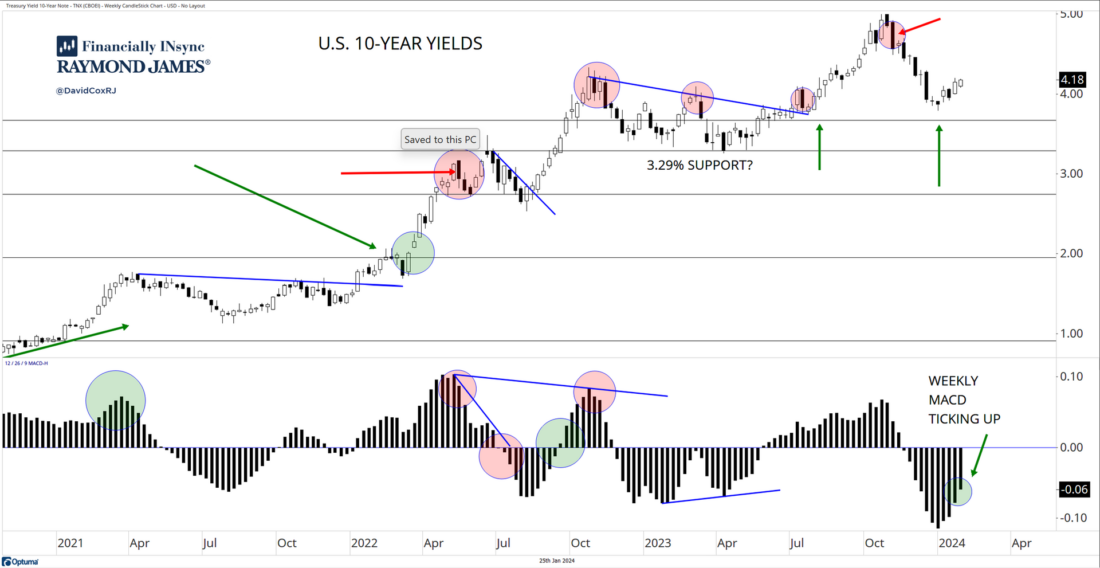
Analysts and economists failed to forecast the significant rise in yields and yet now, we hear them tell us that rates are going to come back down and they’re certain. Here’s the chart of U.S. 10-year U.S. yields. It looks like consolidation to me after a strong rally. I like to use the Moving Average Convergence Divergence (MACD) histogram to point in the direction to lean from an investment and expectation standpoint. What does the histogram show? Most investors (that are familiar with the MACD) would use the signal line itself as the tool, but the difference between the two MACD lines can be viewed in histogram form (as below), and essentially provide a means of gauging if the short-term trend is moving faster or slower than the longer-term trend. The weekly histogram has been ticking upwards for several weeks now, and continues to do so. This helps me gauge and set my own expectations and certainly means piling into bonds is not on our current action list (since yields are inversely related to bond prices).
4/ S&P 500 – What’s the Breadth?
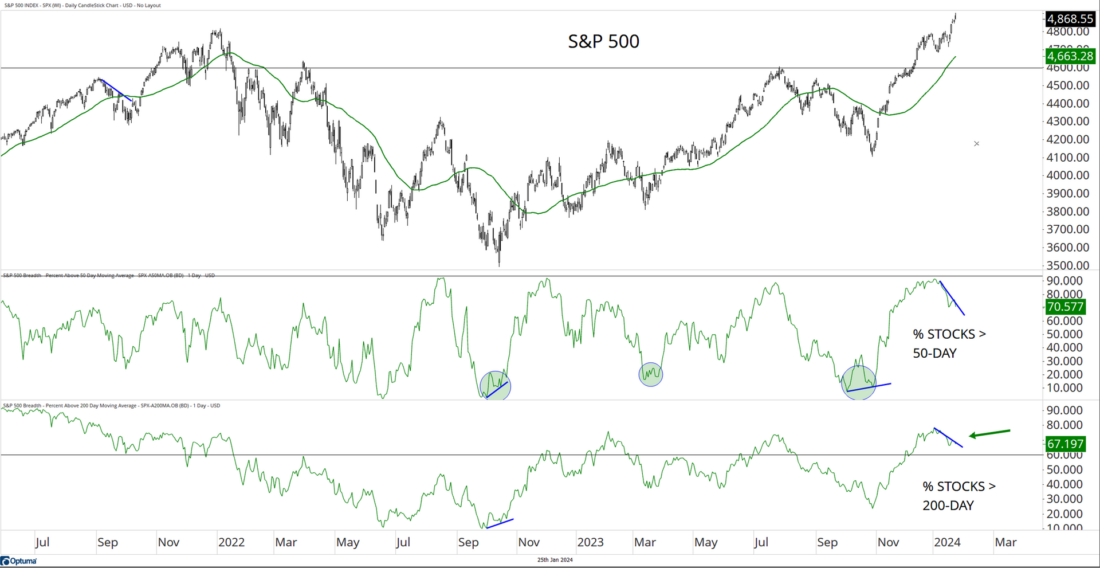
I think we can get far more information than we can by looking at a price index, if we seek to understand how many stocks are participating in the strength (or weakness) of a price move. It’s called market breadth. The S&P 500 contains 500 companies, and we can see in the chart below that 70.6% of those stocks are above a 50-day moving average and 67.2% of them are above a 200-day moving average. A lot of technicians would say that approximately 60% is a useful line in the sand demarking health of a market. What I’m pointing out here in the short-term, is that we’re seeing some bearish divergence, meaning fewer stocks are above those moving averages (starting to fall) while the market is going up anyways. It’s not a big-picture problem (at all), but it’s simply telling us that the stock market is extended. I know full well that many investors are (always!) unwilling to buy the dips, and the pullbacks, and instead find themselves chasing extended markets, and then see some weakness set in shortly afterwards. You don’t get to be surprised if profit-taking arrives in the near-term.
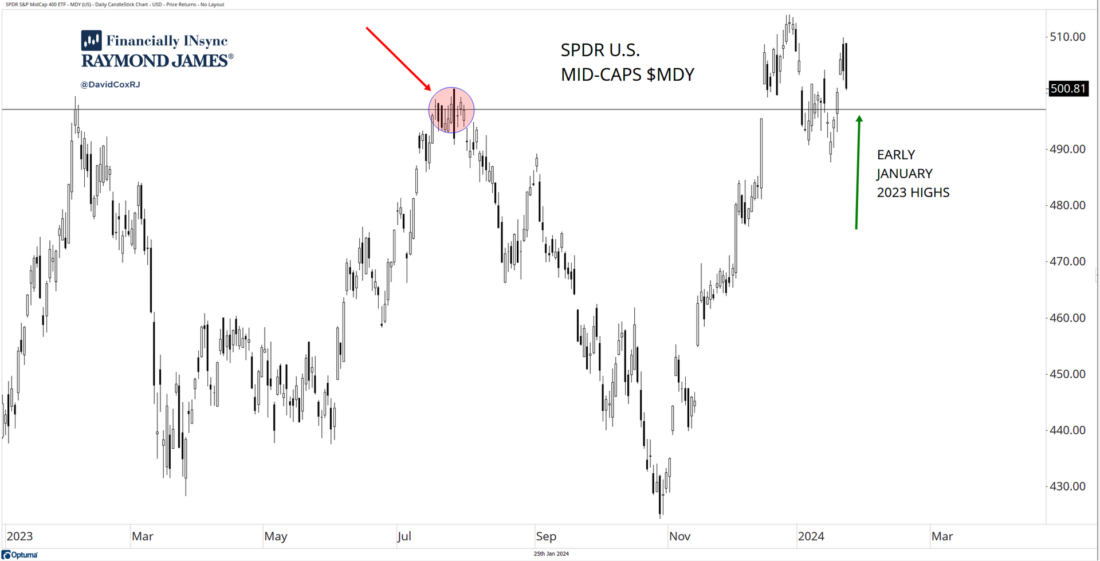
5/ U.S. Mid-Caps
The stock market since the late ’22 lows has been a large-cap story, but here again, we are seeing the potential of more stocks considering participating in the bull market. The SPDR S&P Midcap ETF ($MDY) is currently sitting above the early and mid’23 high points (resistance), which one could now call support (horizontal line). Having gapped up above that line, fallen below again (a failed breakout) and then recovering so quickly, is constructive price action. Let’s watch carefully to see if mid-caps can now exceed those recent highs and print some higher highs and with it, perhaps some relative outperformance vs. large-caps. But let’s not get ahead of ourselves. This has been a weak area of the market, and it needs to prove itself before it really deserves our attention (or at least capital), especially at the index level.
—
Originally posted 26th January 2024
Disclosure: Investopedia
Investopedia.com: The comments, opinions and analyses expressed herein are for informational purposes only and should not be considered individual investment advice or recommendations to invest in any security or to adopt any investment strategy. While we believe the information provided herein is reliable, we do not warrant its accuracy or completeness. The views and strategies described on our content may not be suitable for all investors. Because market and economic conditions are subject to rapid change, all comments, opinions and analyses contained within our content are rendered as of the date of the posting and may change without notice. The material is not intended as a complete analysis of every material fact regarding any country, region, market, industry, investment or strategy. This information is intended for US residents only.
Disclosure: Interactive Brokers
Information posted on IBKR Campus that is provided by third-parties does NOT constitute a recommendation that you should contract for the services of that third party. Third-party participants who contribute to IBKR Campus are independent of Interactive Brokers and Interactive Brokers does not make any representations or warranties concerning the services offered, their past or future performance, or the accuracy of the information provided by the third party. Past performance is no guarantee of future results.
This material is from Investopedia and is being posted with its permission. The views expressed in this material are solely those of the author and/or Investopedia and Interactive Brokers is not endorsing or recommending any investment or trading discussed in the material. This material is not and should not be construed as an offer to buy or sell any security. It should not be construed as research or investment advice or a recommendation to buy, sell or hold any security or commodity. This material does not and is not intended to take into account the particular financial conditions, investment objectives or requirements of individual customers. Before acting on this material, you should consider whether it is suitable for your particular circumstances and, as necessary, seek professional advice.
Disclosure: ETFs
Any discussion or mention of an ETF is not to be construed as recommendation, promotion or solicitation. All investors should review and consider associated investment risks, charges and expenses of the investment company or fund prior to investing. Before acting on this material, you should consider whether it is suitable for your particular circumstances and, as necessary, seek professional advice.

