1/ Election Rally Hangover
2/ Nvidia Earnings
3/ Stocks to Watch: NFLX, WMT, PANW
Investopedia is partnering with CMT Association on this newsletter. The contents of this newsletter are for informational and educational purposes only, however, and do not constitute investing advice. The guest authors, which may sell research to investors, and may trade or hold positions in securities mentioned herein do not represent the views of CMT Association or Investopedia. Please consult a financial advisor for investment recommendations and services.
1/
Election Rally Hangover
The market lacked a follow through punch as the post-election rally on Wall St. faded. In fact, the market went into hangover mode as it gave back half of its recent gains.
This week the market hopes to lift itself back off the mat and come back fighting. It will be about individual stocks stealing the spotlight as market moving economic data is light. There are a few good undercard earnings to watch, but the main event will be the earnings release of 2023 and 2024’s heavyweight champ in Nvidia.
The S&P 500 fell by -2.1% to close at 5870.62. Overall, it wasn’t that alarming of a drawdown, but does set us up at an interesting technical level heading into this week.

Technically, this move can be seen as constructive. The index got to its highest level on its RSI since July and retreated. However, it never was overbought. This was a pattern we noticed on each subsequent high before a small retracement.
This tells us the recent move wasn’t too frothy and can be viewed as a normal retracement at this time. Watch the 5860 area for support. That was the highest close before we gapped above the level post-election. Any failure to hold that and a sell-off to the rising 50-day moving average at 5770 is plausible.
2/
Nvidia Earnings
It is now the biggest stock in the world based on market cap, thus having the biggest weighting in the S&P 500. They are the chip supplier to most of the other “Magnificent 7” stocks and now a member of the Dow Jones Industrial Average.
This one is so big it gets its own section. It will move markets. Let’s break it down – technically of course.
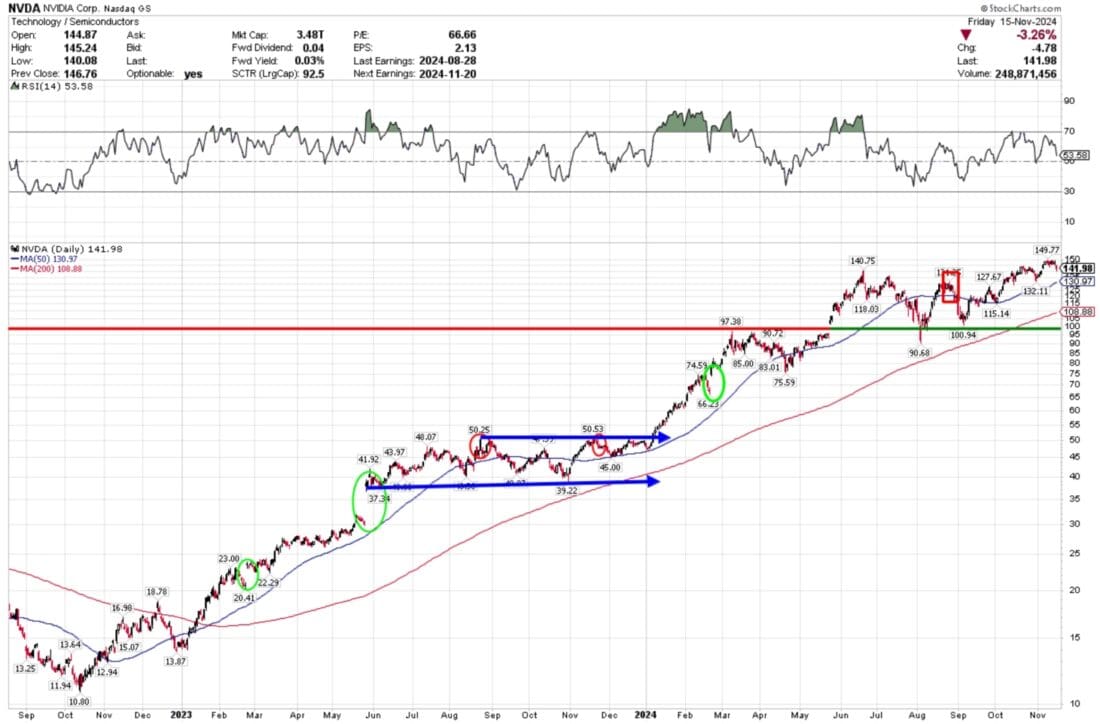
In this chart going back to its October 2022 bottom we examine the climb and pauses along the way. This chart should be used in any introduction to technical analysis class that wants to show a textbook bull run. The stock has gone through several cycles of accumulation and consolidation. These patterns have also occurred seasonally.

That uptrend… it’s textbook. Shares bottomed in October 2022 and began the climb higher and have yet to look back. In early 2023 the stock experienced a “golden cross” – a buy signal when the 50-day moving average crosses above 200-day. This can be a lagging indicator, but over the long-term it can be a great trending prognosticator.
The stock retraced all of its 2022 loss and then broke out to new highs in June 2023. Shares gapped on earnings several times (in green) and never looked back. Then over the second half of the year it lost momentum and even earnings couldn’t save it. The stock traded in a long neutral range from June to December of 2023 before breaking out in January. The momentum continued into its February earnings. It slowed again in June and a solid August earnings failed to lift it higher.
Today we see the same trend playing out. Shares consolidated in a wide neutral range going back to June. However, in both cases when shares consolidated the RSI showed a positive bullish divergence. The strength in its RSI even while price was fairly neutral, was a harbinger of positive price action ahead.
The set-up going into this earnings cycle is quite similar. The stock has had a tremendous year (up 185% year-to-date) and is holding on to those gains. It looks ready to take that next leg higher – or worst case fall back into its recent neutral range. Even in that range the lows get higher and higher and that makes the case for a move upward as well.

Earnings reaction pattern… The big moves tend to happen in spring and summer and then the stock rests in autumn to year end. Are we about to see a continuation of that resting period?
Shares have consistently beaten estimates and chances are they will do it again this quarter, but will it be enough to take another sizable leg higher? The average move on earnings days are +/- 7.4%, but not over the last two reporting quarters of the year.
There’s something about that August and November release that never seems to ignite the rally. The last three August’s have seen the stock gain 4.01%, 0.10% and lose 6.38%, respectively. The last two November’s saw declines of -1.46% and -2.46%. Will this November break the streak?
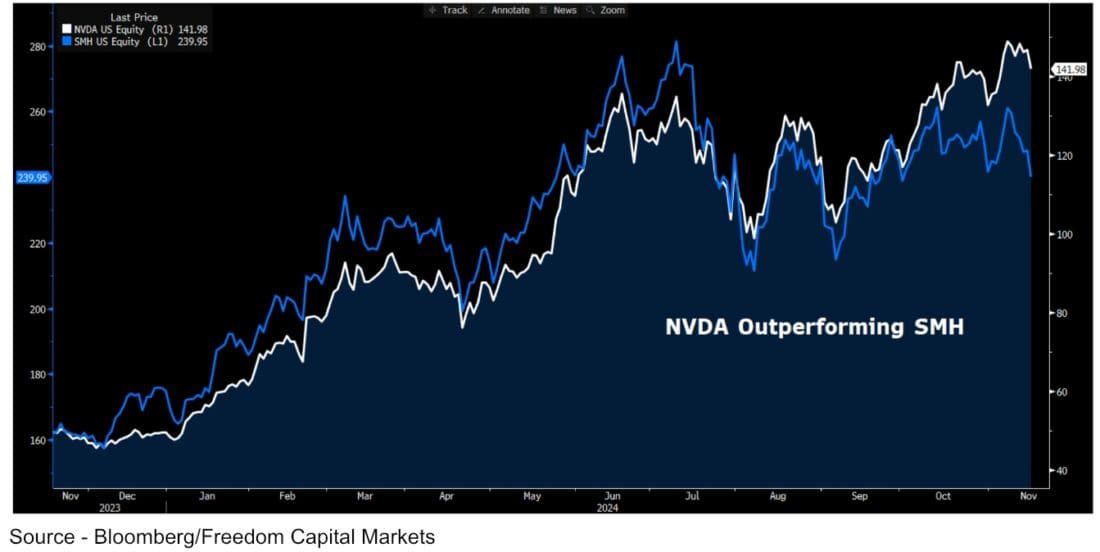
What’s Different This Time? Coming into earnings NVDA is outperforming the VanEck Semiconductor ETF – SMH by its greatest margin ever. Usually the semis have trended better than or if not equal to NVDA.

Lately the semiconductor sector as measured by the SMH has been underperforming the overall market since its peak in July. It is currently -15% off its highs, while Nvidia, which makes up 23.6% of that index, made a new high just last week.
This begs the question coming into Wednesday afternoon’s result – will it bring the sector back to life or will it be sucked down with it as well?
The hope is that it beats its raised guidance – again – and gets the follow through to the upside. But as we’ve seen during this seasonal period it doesn’t always work that way.
No matter which way it breaks, it will have a huge impact on the technology sector and the overall market itself.
Levels to Watch… So where can the stock go next? A breakout on positive earnings another 25-35% pop is likely. The momentum will be there, but wait to see if any after hour momentum continues over the first hour of trading on Thursday.
To the downside, the 100-day moving average has been a good barometer for the stock over the last year. It has only closed below this level SIX times in the last year and each dip has been a good buying opportunity. That would bring shares to the $124.75 area. Ultimate support is around $100. To get there it would take a shockingly unexpected event to occur. That seems unlikely.
3/
Stocks to Watch: NFLX, WMT, PANW
Netflix made its biggest splash into the world of sports streaming last Friday night to mixed reviews. The much hyped Jake Paul vs Mike Tyson fight fell flat to those wanting great pugilistic action, but the streaming giant reported 60 million households worldwide tuned into the event.

However with 60 million+ concurrent streams there were a few glitches that had many viewers up in arms. Close to 100,000 customers reported lagging issues, poor image quality and their stream failing completely. This leaves viewers and investors questioning how Netflix will be able to handle the demand for its NFL debut on Christmas Day.
The good news is that they have a month to resolve these issues. The hope is that the focus at the Monday watercooler will be on that great undercard between Katie Taylor and Amanda Serrano and the thievery of the judges, and not on the main event and streaming issues that plagued many viewers.
Going into this week Netflix shares are trading at $823.96 and are up 69% year-to-date.
Earnings. The slate of reports is starting to ease, but this week we get many sector leaders that could impact markets. Nvidia is not only the biggest stock in the world, but it will have a severe impact on semiconductor stocks. In retail, we get three of the biggest names Walmart, Target and Lowe’s. Lastly one of the biggest names in cybersecurity reports in PaloAlto Networks.

—-
Originally posted 18th November 2024
Disclosure: Investopedia
Investopedia.com: The comments, opinions and analyses expressed herein are for informational purposes only and should not be considered individual investment advice or recommendations to invest in any security or to adopt any investment strategy. While we believe the information provided herein is reliable, we do not warrant its accuracy or completeness. The views and strategies described on our content may not be suitable for all investors. Because market and economic conditions are subject to rapid change, all comments, opinions and analyses contained within our content are rendered as of the date of the posting and may change without notice. The material is not intended as a complete analysis of every material fact regarding any country, region, market, industry, investment or strategy. This information is intended for US residents only.
Disclosure: Interactive Brokers
Information posted on IBKR Campus that is provided by third-parties does NOT constitute a recommendation that you should contract for the services of that third party. Third-party participants who contribute to IBKR Campus are independent of Interactive Brokers and Interactive Brokers does not make any representations or warranties concerning the services offered, their past or future performance, or the accuracy of the information provided by the third party. Past performance is no guarantee of future results.
This material is from Investopedia and is being posted with its permission. The views expressed in this material are solely those of the author and/or Investopedia and Interactive Brokers is not endorsing or recommending any investment or trading discussed in the material. This material is not and should not be construed as an offer to buy or sell any security. It should not be construed as research or investment advice or a recommendation to buy, sell or hold any security or commodity. This material does not and is not intended to take into account the particular financial conditions, investment objectives or requirements of individual customers. Before acting on this material, you should consider whether it is suitable for your particular circumstances and, as necessary, seek professional advice.

