1/ December Gold Daily Chart
2/ Gold Daily Trend and Weekly Momentum
3/ December Silver Daily Chart
Investopedia is partnering with CMT Association on this newsletter. The contents of this newsletter are for informational and educational purposes only, however, and do not constitute investing advice. The guest authors, which may sell research to investors, and may trade or hold positions in securities mentioned herein do not represent the views of CMT Association or Investopedia. Please consult a financial advisor for investment recommendations and services.
1/
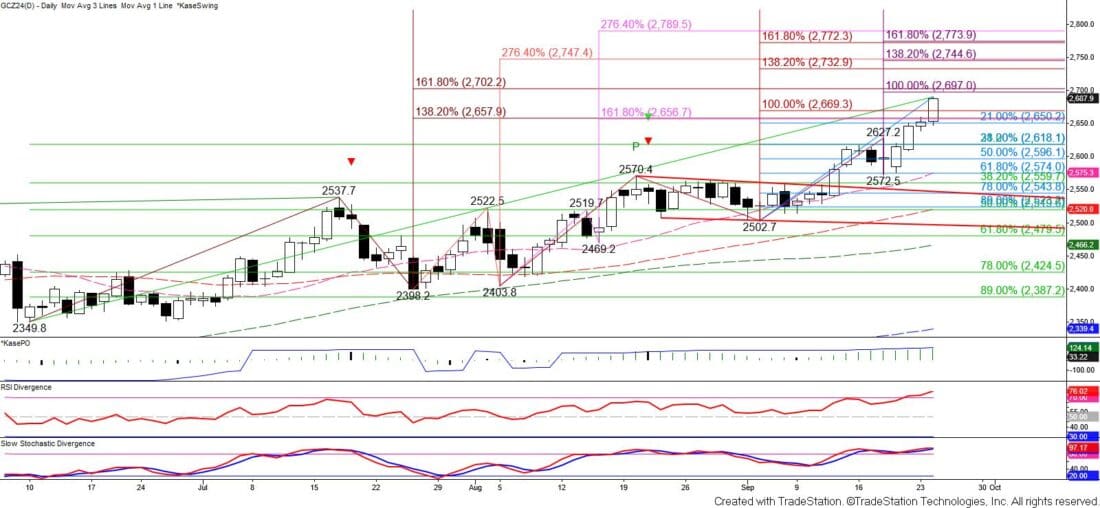
December Gold Daily Chart
December gold has been on the rise in recent weeks after breaking higher out of a wedge pattern on September 12. Signs of a weakening U.S. dollar index, the wave formation up from the last major swing low at $2349.8, and daily trend indicators imply that gold should continue to rise.
Prices settled above the $2658 intermediate (1.382) target of the primary wave up from $2349.8 (dark red) and negated Monday’s evening star setup on Tuesday. The move up is now poised to reach the $2700 larger than (1.618) target of this wave. This is a potential stalling point given the importance of the 1.618 Fibonacci extension and the psychological importance of the even $2700 level.
Courtesy of TradeStation
Moreover, the daily RSI and Stochastic are overbought and suggest that a correction should take place soon. The daily KasePO is also nearing overbought territory.
The challenge is that there are no bearish patterns or confirmed signals that call for the move up to stall. Should $2700 hold, a pullback will likely be a correction and support at $2618, the 21 percent retracement of the rise from $2349.8 (light green) and 38 percent retracement from $2502.7 (light blue), is expected to hold. Closing below this would call for a test of crucial support at $2567, which is split between the respective 38 and 62 percent retracements. Settling below $2567 would suggest a bearish reversal is underway and call for a much more substantial test of support.
2/
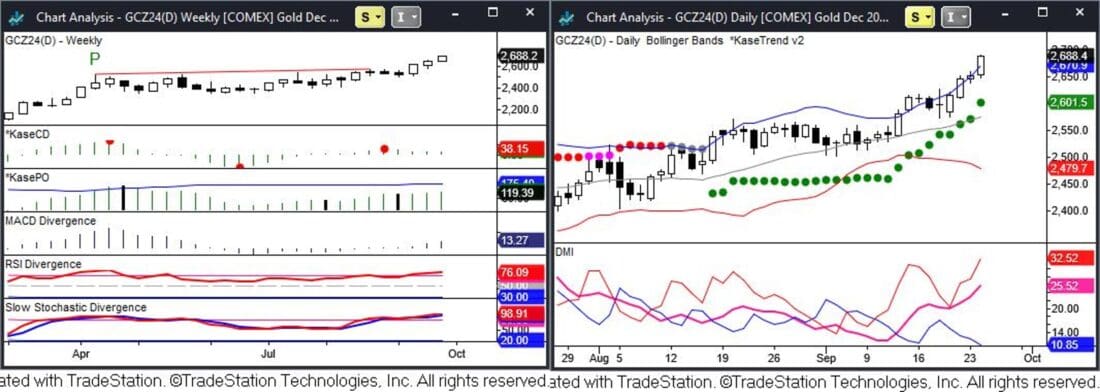
Gold Daily Trend and Weekly Momentum
The strength of gold’s uptrend is validated by a bullish daily Kase Trend indicator (green dot), a widening bullish 10-day DMI indicator, and a rising ADX that is above 25.
Courtesy of TradeStation
November gold has also settled back above the upper daily Bollinger Band for the past few days. This reflects a strong uptrend but also warns that the move up is overbought and due for a correction. Overbought weekly RSI and Stochastic momentum oscillators also warn that a bearish reversal, or at least a solid test of support, should take place soon.
In summary, gold’s uptrend is poised to extend to at least $2700. Settling above $2700 might initially be a challenge but will open the way for tests of confluent targets at $2733, $2746, and $2773.
However, caution is warranted because the overbought daily and weekly momentum oscillators and the importance of $2700 indicate a correction will probably take place soon.
3/
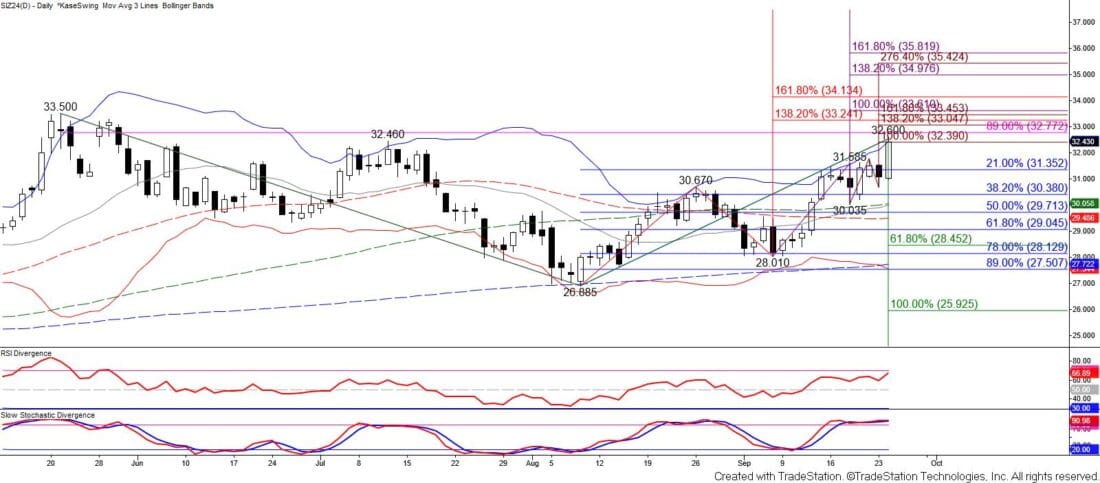
December Silver Daily Chart
December silver is poised to rise to a new contract high of at least $33.24 within the next few days.
Tuesday’s close above the $32.460 swing high invalidated the prior primary wave down from $33.500. Prices also settled above the $32.39 equal to (1.00) target of the subwave up from $30.305 (dark red). There is minor resistance at $32.77, the 89 percent retracement of the decline from $33.500. However, the primary wave up from $26.885 (red) is poised to reach its $33.24 intermediate (1.382) target. Settling above this will call for the $34.13 larger than (1.618) target to be fulfilled.
Courtesy of TradeStation
Settling above $34.13 might initially be a challenge. Once this target is fulfilled a test of support is anticipated. A simple correction will hold the 38 percent retracement, which at that point would be $31.36 provided $34.13 holds.
An overbought daily Stochastic and test of the upper Bollinger Band also warn that a correction should take place soon. The daily RSI is also nearing overbought territory and there is potential for daily bearish RSI and Stochastic divergence once silver overcomes the $33.500 swing high.
The $31.36 level is currently the 21 percent retracement of the rise from $26.885. Should a correction take place before overcoming $32.77 this level is expected to hold. Closing below $32.77 would call for a test of key near-term support and the 38 percent retracement at $30.38. Settling below $30.38 would warn that the move up will fail to reach $33.24 and $34.13.
—
Originally posted 25th September 2024
Disclosure: Investopedia
Investopedia.com: The comments, opinions and analyses expressed herein are for informational purposes only and should not be considered individual investment advice or recommendations to invest in any security or to adopt any investment strategy. While we believe the information provided herein is reliable, we do not warrant its accuracy or completeness. The views and strategies described on our content may not be suitable for all investors. Because market and economic conditions are subject to rapid change, all comments, opinions and analyses contained within our content are rendered as of the date of the posting and may change without notice. The material is not intended as a complete analysis of every material fact regarding any country, region, market, industry, investment or strategy. This information is intended for US residents only.
Disclosure: Interactive Brokers
Information posted on IBKR Campus that is provided by third-parties does NOT constitute a recommendation that you should contract for the services of that third party. Third-party participants who contribute to IBKR Campus are independent of Interactive Brokers and Interactive Brokers does not make any representations or warranties concerning the services offered, their past or future performance, or the accuracy of the information provided by the third party. Past performance is no guarantee of future results.
This material is from Investopedia and is being posted with its permission. The views expressed in this material are solely those of the author and/or Investopedia and Interactive Brokers is not endorsing or recommending any investment or trading discussed in the material. This material is not and should not be construed as an offer to buy or sell any security. It should not be construed as research or investment advice or a recommendation to buy, sell or hold any security or commodity. This material does not and is not intended to take into account the particular financial conditions, investment objectives or requirements of individual customers. Before acting on this material, you should consider whether it is suitable for your particular circumstances and, as necessary, seek professional advice.
Disclosure: Futures Trading
Futures are not suitable for all investors. The amount you may lose may be greater than your initial investment. Before trading futures, please read the CFTC Risk Disclosure. A copy and additional information are available at ibkr.com.
Disclosure: Forex
There is a substantial risk of loss in foreign exchange trading. The settlement date of foreign exchange trades can vary due to time zone differences and bank holidays. When trading across foreign exchange markets, this may necessitate borrowing funds to settle foreign exchange trades. The interest rate on borrowed funds must be considered when computing the cost of trades across multiple markets.
