By Todd Stankiewicz CMT, CFP, ChFC
1/ Healthcare Emerging?
2/ Is Healthcare on the Mend? A Closer Look at Relative Performance
3/ Worst Month of the Year
Investopedia is partnering with CMT Association on this newsletter. The contents of this newsletter are for informational and educational purposes only, however, and do not constitute investing advice. The guest authors, which may sell research to investors, and may trade or hold positions in securities mentioned herein do not represent the views of CMT Association or Investopedia. Please consult a financial advisor for investment recommendations and services.
1/
Healthcare Emerging?

One of my favorite tools for market analysis is Relative Rotation Graphs (RRGs). This tool provides a quick visual representation of how different asset classes or sectors are performing relative to a central benchmark, in this case, the S&P 500 index.
RRGs map assets across four quadrants, typically moving clockwise over time:
Leading – Strong relative momentum and performance.
Weakening – Losing momentum, but still relatively strong.
Lagging – Underperforming with weak momentum.
Improving – Gaining momentum, but not yet leading.
Each asset’s tail on the graph shows its position over previous weeks, giving insight into its trajectory.
Over the past five weeks, healthcare, previously stuck in the lagging quadrant, has started shifting into the improving quadrant. This suggests that relative strength is building compared to the S&P 500.
While not a definitive buy signal, this early-stage rotation could indicate an opportunity. If healthcare continues its momentum and moves into the leading quadrant, it might warrant a closer look for investors.
2/
Is Healthcare on the Mend? A Closer Look at Relative Performance
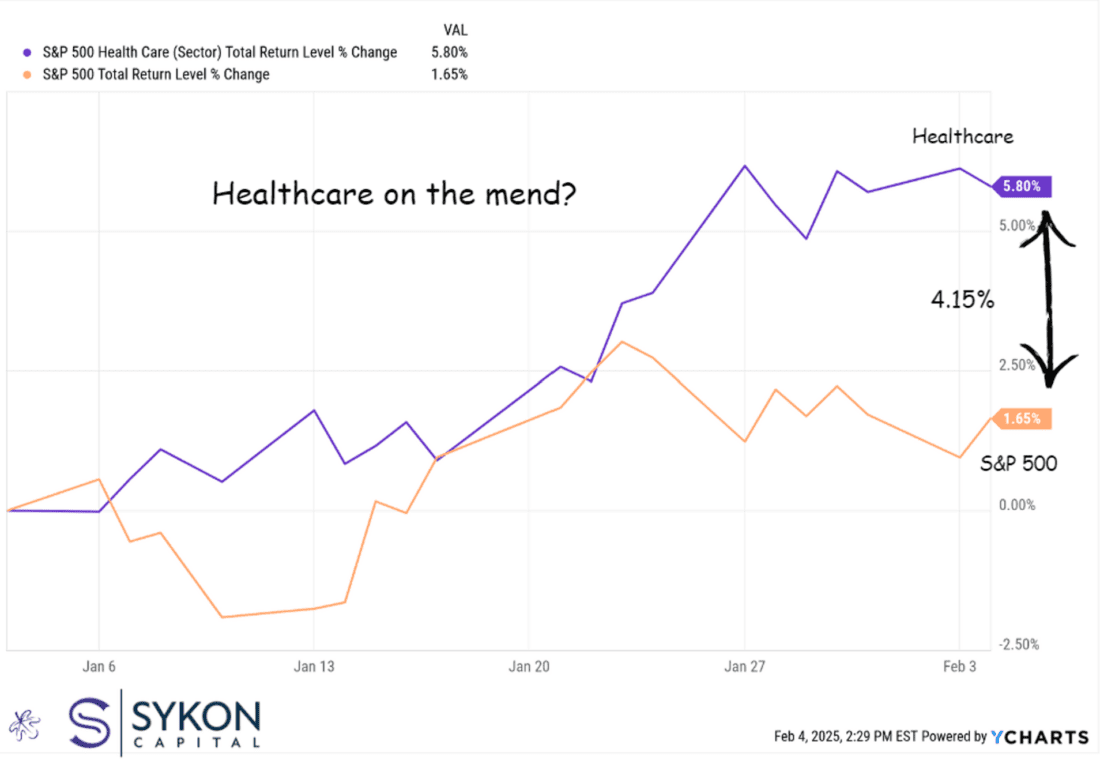
To put the previous point into a more traditional chart format, we can see that healthcare has been steadily gaining ground against the S&P 500 over the past month. On a total return basis, healthcare has outperformed by 4.15% relative to the broader index.
This serves as a key reminder that not all sectors move in lockstep, even in volatile markets, opportunities can emerge. Sector rotation and relative strength analysis can help identify areas of resilience when the broader market is uncertain.
3/
Worst Month of the Year
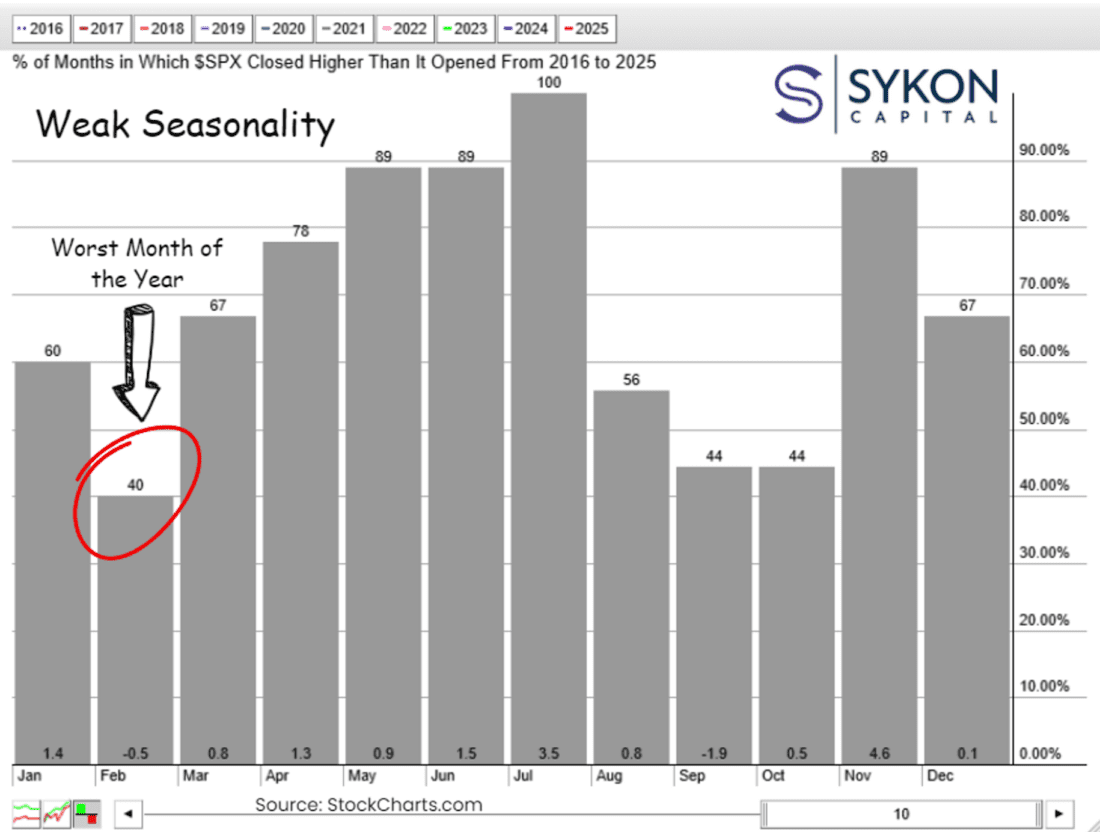
Over the past 10 years, February has been the worst-performing month for the S&P 500. The index has posted gains in only 40% of those years, with an average return of -0.5%.
This historical trend suggests that a market pullback in February wouldn’t be unusual, and more importantly, it likely has little predictive value for the rest of the year. Similar to the January Barometer myth, short-term seasonal trends don’t necessarily dictate long-term performance.
The good news? We’re about to enter the strongest five-month stretch for the S&P 500 based on the past decade’s data. Stay vigilant in the short term, but remain flexible because historically, the odds have favored investors in the months ahead.
Disclaimer: Advisory Services offered through Sykon Capital, LLC, a registered investment advisor with the U.S. Securities and Exchange Commission. This material is intended for informational purposes only. It should not be construed as legal or tax advice and is not intended to replace the advice of a qualified attorney or tax advisor. The information contained in this presentation has been compiled from third party sources and is believed to be reliable as of the date of this report. Past performance is not indicative of future returns and diversification neither assures a profit nor guarantees against loss in a declining market. Investments involve risk and are not guaranteed.
—
Originally posted 5th February 2025
Disclosure: Investopedia
Investopedia.com: The comments, opinions and analyses expressed herein are for informational purposes only and should not be considered individual investment advice or recommendations to invest in any security or to adopt any investment strategy. While we believe the information provided herein is reliable, we do not warrant its accuracy or completeness. The views and strategies described on our content may not be suitable for all investors. Because market and economic conditions are subject to rapid change, all comments, opinions and analyses contained within our content are rendered as of the date of the posting and may change without notice. The material is not intended as a complete analysis of every material fact regarding any country, region, market, industry, investment or strategy. This information is intended for US residents only.
Disclosure: Interactive Brokers
Information posted on IBKR Campus that is provided by third-parties does NOT constitute a recommendation that you should contract for the services of that third party. Third-party participants who contribute to IBKR Campus are independent of Interactive Brokers and Interactive Brokers does not make any representations or warranties concerning the services offered, their past or future performance, or the accuracy of the information provided by the third party. Past performance is no guarantee of future results.
This material is from Investopedia and is being posted with its permission. The views expressed in this material are solely those of the author and/or Investopedia and Interactive Brokers is not endorsing or recommending any investment or trading discussed in the material. This material is not and should not be construed as an offer to buy or sell any security. It should not be construed as research or investment advice or a recommendation to buy, sell or hold any security or commodity. This material does not and is not intended to take into account the particular financial conditions, investment objectives or requirements of individual customers. Before acting on this material, you should consider whether it is suitable for your particular circumstances and, as necessary, seek professional advice.
