By Todd Stankiewicz CMT, CFP, ChFC
1/ Don’t Chase Past Performance
2/ Almost Textbook
3/ Key Levels
Investopedia is partnering with CMT Association on this newsletter. The contents of this newsletter are for informational and educational purposes only, however, and do not constitute investing advice. The guest authors, which may sell research to investors, and may trade or hold positions in securities mentioned herein do not represent the views of CMT Association or Investopedia. Please consult a financial advisor for investment recommendations and services.
1/
Don’t Chase Past Performance

The media has been buzzing with advice to shift savings into equities because recent returns have outpaced the risk-free rate. But if your reason for investing more in equities is the strong returns of the last two years, you may be walking into a trap.
Here’s the reality: Historically, after the best two-year market returns, the following year was lower 67% of the time. Meanwhile, after bad years, the market outperformed the average return 80% of the time.
Chasing returns based on past performance is likely a recipe for disappointment. Instead, focus on a forward-looking process to assess risk and reward.
There’s a reason every investment disclaimer reads: Past performance is not indicative of future results.
2/
Almost Textbook
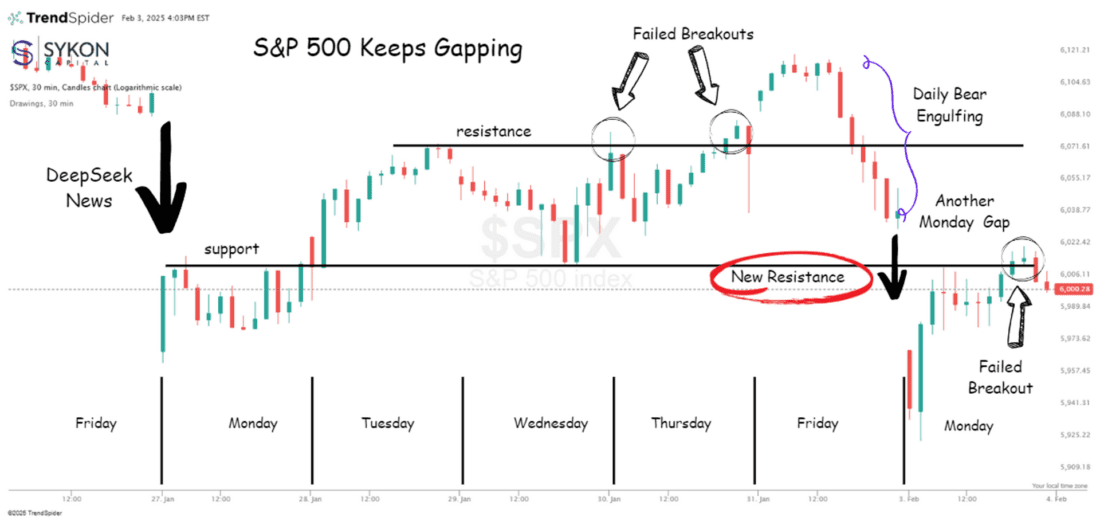
The market never fails to keep things interesting.
Over the past week, the S&P 500 has been on a rollercoaster, and today’s gap lower on tariff fears is a perfect example of how technical levels continue to play a crucial role. What was once a key support level has now flipped into resistance, and the index has some work to do if it’s going to make a meaningful move higher.
To regain momentum, the S&P 500 needs to reclaim this level and, more importantly, close the last two gaps on the chart. Until that happens, any rally attempt faces an uphill battle.
What’s particularly fascinating is how textbook this price action has been from a technical perspective. The way the index has respected support and resistance zones, reacted to gaps, and followed classic trading patterns makes for an intriguing case study in market behavior. It’s a reminder that while headlines drive short-term moves, technicals still provide a valuable roadmap.
For now, all eyes are on whether the S&P 500 can break through this new resistance. If it does, it could set the stage for the next leg higher. If not, the downside risk remains very real.
Buckle up, this one is far from over.
3/
Key Levels
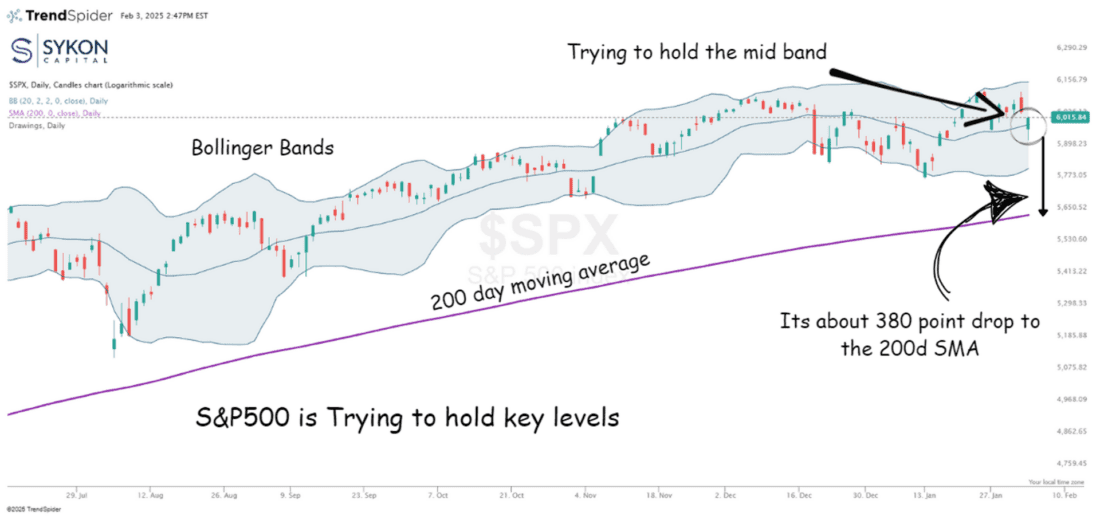
Despite a major gap down, the S&P 500 is battling to hold its ground at the middle Bollinger Band (5,986.91). This level is often a critical support zone, and a close below it would shift focus to the lower Bollinger Band at 5,813.25. Holding this mid-line will be key in determining whether the market can stabilize or if further downside risk is in play.
I prefer Bollinger Bands over traditional moving averages because they are more adaptive to price action. If you’re relying solely on the 200-day moving average, you’re looking at a much wider risk window, potential 380-point drop before hitting that level at 5,635. That’s nearly 6% below the 6,000 mark, which may not be the most efficient way to manage risk in a fast-moving market.
The bottom line? Know your levels and be intentional with risk management. Is your approach adaptive, or is it static? Markets evolve, and so should your strategy. And above all, don’t get too caught up in the emotional swings of daily price action. The bigger picture still favors long-term trends over short-term noise.
Let’s see how the index responds in the coming sessions, this is a critical inflection point.
Disclaimer: Advisory Services offered through Sykon Capital, LLC, a registered investment advisor with the U.S. Securities and Exchange Commission. This material is intended for informational purposes only. It should not be construed as legal or tax advice and is not intended to replace the advice of a qualified attorney or tax advisor. The information contained in this presentation has been compiled from third party sources and is believed to be reliable as of the date of this report. Past performance is not indicative of future returns and diversification neither assures a profit nor guarantees against loss in a declining market. Investments involve risk and are not guaranteed.
—
Originally posted 4th February 2025
Disclosure: Investopedia
Investopedia.com: The comments, opinions and analyses expressed herein are for informational purposes only and should not be considered individual investment advice or recommendations to invest in any security or to adopt any investment strategy. While we believe the information provided herein is reliable, we do not warrant its accuracy or completeness. The views and strategies described on our content may not be suitable for all investors. Because market and economic conditions are subject to rapid change, all comments, opinions and analyses contained within our content are rendered as of the date of the posting and may change without notice. The material is not intended as a complete analysis of every material fact regarding any country, region, market, industry, investment or strategy. This information is intended for US residents only.
Disclosure: Interactive Brokers
Information posted on IBKR Campus that is provided by third-parties does NOT constitute a recommendation that you should contract for the services of that third party. Third-party participants who contribute to IBKR Campus are independent of Interactive Brokers and Interactive Brokers does not make any representations or warranties concerning the services offered, their past or future performance, or the accuracy of the information provided by the third party. Past performance is no guarantee of future results.
This material is from Investopedia and is being posted with its permission. The views expressed in this material are solely those of the author and/or Investopedia and Interactive Brokers is not endorsing or recommending any investment or trading discussed in the material. This material is not and should not be construed as an offer to buy or sell any security. It should not be construed as research or investment advice or a recommendation to buy, sell or hold any security or commodity. This material does not and is not intended to take into account the particular financial conditions, investment objectives or requirements of individual customers. Before acting on this material, you should consider whether it is suitable for your particular circumstances and, as necessary, seek professional advice.
