By Brian Dolan, From Investopedia
The Santa Claus Rally
Investopedia is partnering with CMT Association on this newsletter. The contents of this newsletter are for informational and educational purposes only, however, and do not constitute investing advice. The guest authors, which may sell research to investors, and may trade or hold positions in securities mentioned herein do not represent the views of CMT Association or Investopedia. Please consult a financial advisor for investment recommendations and services.
The Santa Claus Rally Defined
If there is such a rally, when does it occur?
There are two schools of thought about the timing of the Santa Claus rally effect on the Standard & Poor’s (S&P) 500 Index. The first suggests the Santa Claus rally occurs in the week leading up to and ending with Dec. 24, Christmas Eve. The other scenario suggests the Santa Claus rally occurs in the week following Christmas, up to and including the first two trading days of the New Year. After studying the returns of both scenarios, we believe the Santa Claus rally, to the extent that it exists, occurs in the week leading up to Christmas.
The week before Christmas typically has normal to significant volume, compared with the week after Christmas, which is usually marked by generally sideways stock-price movement with small ranges. The week before Christmas also captures much of the end-of-the-year adjustments from institutional players seeking to close their books before the Christmas holiday. The week after Christmas usually comes with much lower volume, suggesting that institutional players have withdrawn from the market for the rest of the year.
For the purposes of defining when the Santa Claus rally happens—to the extent it does—our research leads us to focus on the week before Christmas to document the potential Santa Claus rally effect.
Does the Santa Claus Rally Exist?
The second major question is whether the Santa Claus rally really even exists. Again, looking at the historical performance of the S&P 500 over the last two decades, we conclude that it is nearly a toss-up between a tangible rally and a normal trading week.
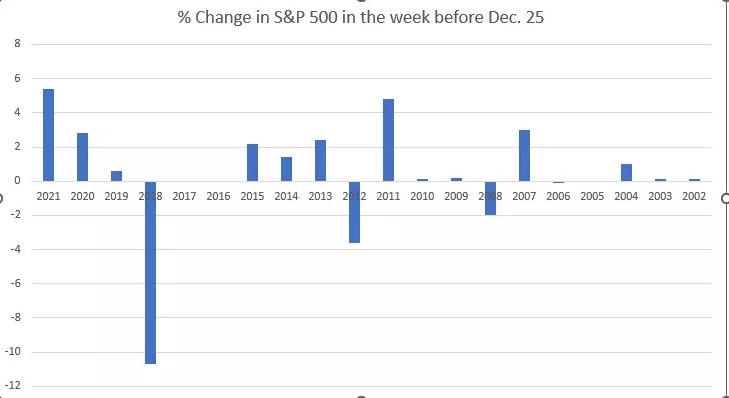
For the average return of the week leading up to Christmas, the so-called Santa Claus rally, we calculated a +0.385% total return, with 13 winning weeks, five losing weeks, and two unchanged weeks. More important, the average winning week gave a +1.85% return, while the losing weeks averaged a -3.28% return, skewing the risk/reward ratio against the trade (being long S&P 500). The range of returns was +5.4% to -10.7%. (Author’s calculations.)
Overall, we cannot discern a viable rally period that occurs on a regular or reliable basis around the end-of-year holidays. The graph below shows the weekly returns for the Santa Claus rally period over the last 20 years:

Rationalizations for the Santa Claus Effect
Over the years, many analysts have tried to speculate about the reasons for the Santa Claus rally. The perceived causes for the rally include an overall, holiday-season spirit, in which retail traders hold an outsize bullish outlook and institutional players tend to step back from the market.
Regardless of the reason, any positive return leading up to and after Christmas is likely to be hailed by the financial media as a “Santa Claus rally.”2 Traders should be aware of the historical performance of the Santa Claus rally period, and remain wary of getting sucked in by hopes for momentary positive performance.
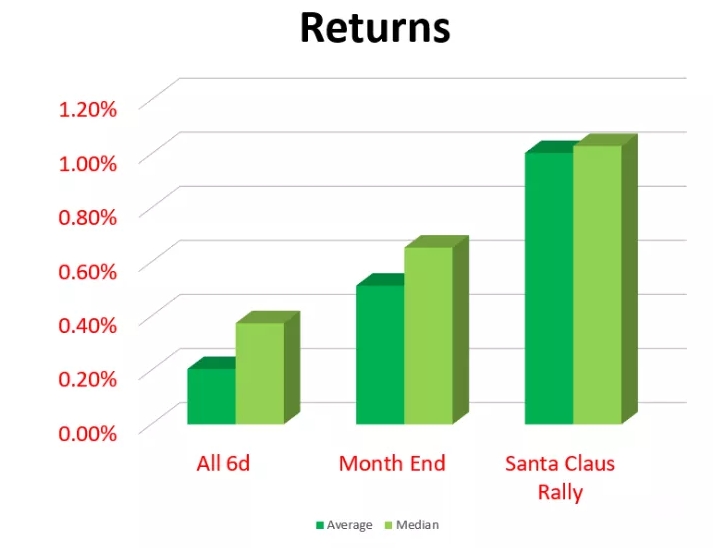
For reference, the chart below compares the results of trading in any random six-day period in the past 26 years with the results of trading two kinds of six-day groupings. The first is the turn-of-month effect, four sessions at the end of a month and two sessions into the next month. The second is specifically the returns from trading the Santa Claus rally belief. Note the negligible returns across all categories.

Is There Really a Santa Claus Rally?
Our analysis shows that there is a negligible positive tilt associated with the Santa Claus rally period, namely +0.385% over the last 20 years (Author’s calculations). With that in mind, we think the so-called Santa Claus rally is shaky at best. But that won’t stop the financial media and pundits from referring to it, should any positive trading days unfold around the holiday period. In general, traders should be aware of the tenuous nature of making any moves during the holiday season.
What Is the Time Period for the Santa Claus Rally?
There are two schools of thought about when the rally can occur. One is that stocks rally in the week between Christmas and New Year’s, and that carries into the second day of trading in the New Year, usually Jan 2. The other time-span definition—and our preferred one—is the week leading up to Dec. 24. But both time periods show negligible returns at best on average, making the Santa Claus rally something of a myth, just like the jolly old elf himself.
What Is the Rationale Behind the Santa Claus Rally?
To the minimal extent that it exists, the biggest rationale may be that it is simply a matter of positive holiday spirit extending to the stock market for a few days. Most institutional players such as hedge funds, corporations, and the like, attend to their year-end position adjustments in the week before Christmas and start looking ahead in to the new year to strategize. There also may be year-end effects at work, such as portfolio rebalancing and tax-loss harvesting, to name a few.
The Bottom Line
Using the week leading up to Dec. 24 over two decades, we find there is no tangible or reliable Santa Claus rally. Whether you count that time period or the week after Dec. 25 up to Jan. 2 of the new year, the returns are negligible, if slightly positive at +0.385%.
Traders should be wary of market talk surrounding the notion of a Santa Claus rally, and stay fixed on the current market environment. While we can expect Santa Claus to deliver presents on time, we can’t expect him to always deliver reliable stock-market gains.
Diversify with Large and Small Cap Index Options
For efficient diversification, you may want to consider pairing large cap and small cap index options. While SPX® and XSP® track the S&P 500, RUT® and MRUT® track the Russell 2000. Combined, these index options may provide complete market exposure.
—
Originally posted 13th December 2024
Disclosure: Investopedia
Investopedia.com: The comments, opinions and analyses expressed herein are for informational purposes only and should not be considered individual investment advice or recommendations to invest in any security or to adopt any investment strategy. While we believe the information provided herein is reliable, we do not warrant its accuracy or completeness. The views and strategies described on our content may not be suitable for all investors. Because market and economic conditions are subject to rapid change, all comments, opinions and analyses contained within our content are rendered as of the date of the posting and may change without notice. The material is not intended as a complete analysis of every material fact regarding any country, region, market, industry, investment or strategy. This information is intended for US residents only.
Disclosure: Interactive Brokers
Information posted on IBKR Campus that is provided by third-parties does NOT constitute a recommendation that you should contract for the services of that third party. Third-party participants who contribute to IBKR Campus are independent of Interactive Brokers and Interactive Brokers does not make any representations or warranties concerning the services offered, their past or future performance, or the accuracy of the information provided by the third party. Past performance is no guarantee of future results.
This material is from Investopedia and is being posted with its permission. The views expressed in this material are solely those of the author and/or Investopedia and Interactive Brokers is not endorsing or recommending any investment or trading discussed in the material. This material is not and should not be construed as an offer to buy or sell any security. It should not be construed as research or investment advice or a recommendation to buy, sell or hold any security or commodity. This material does not and is not intended to take into account the particular financial conditions, investment objectives or requirements of individual customers. Before acting on this material, you should consider whether it is suitable for your particular circumstances and, as necessary, seek professional advice.
Disclosure: Opciones
Las opciones implican riesgos y no son adecuadas para todos los inversionistas. Para obtener más información, lea las “Características y riesgos de las opciones estandarizadas” o ODD, a la que se puede acceder a través del enlace que se encuentra en la página de descripción del podcast.

