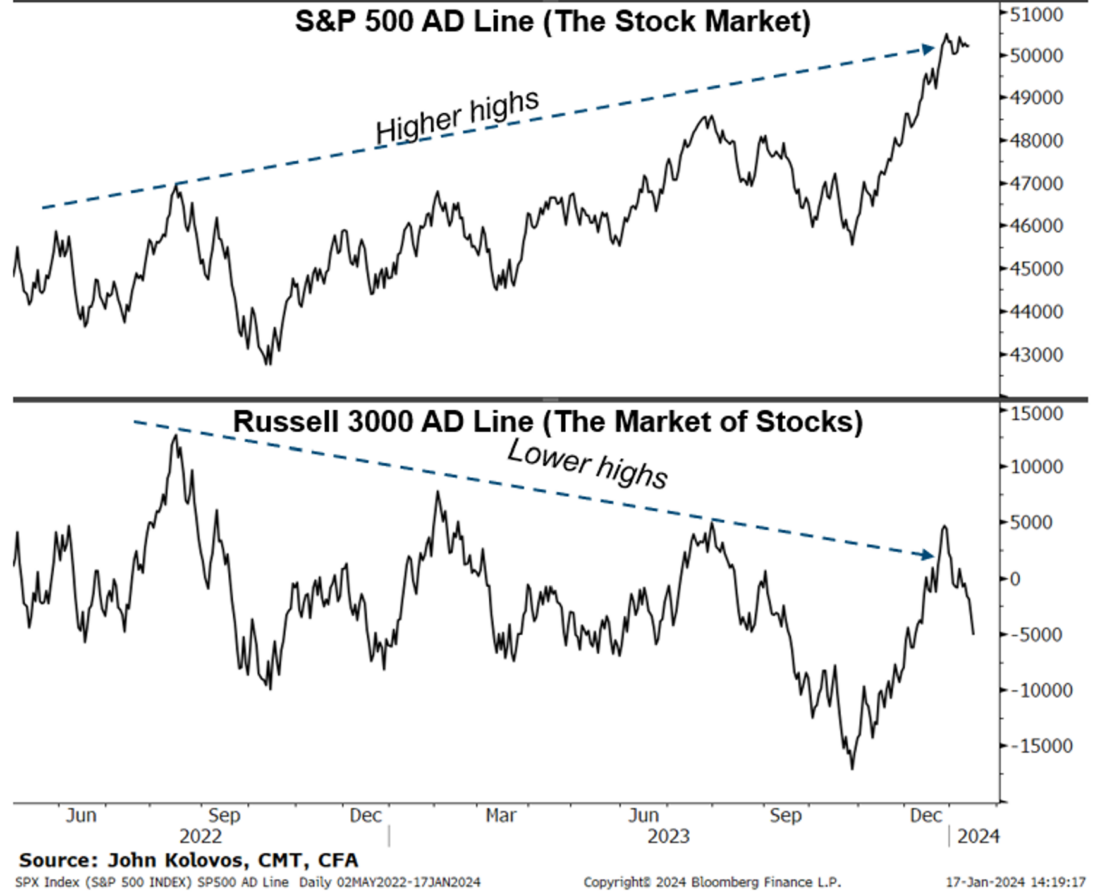
1/ It Is OK to Be Bullish The S&P 500, But Not The Market of Stocks
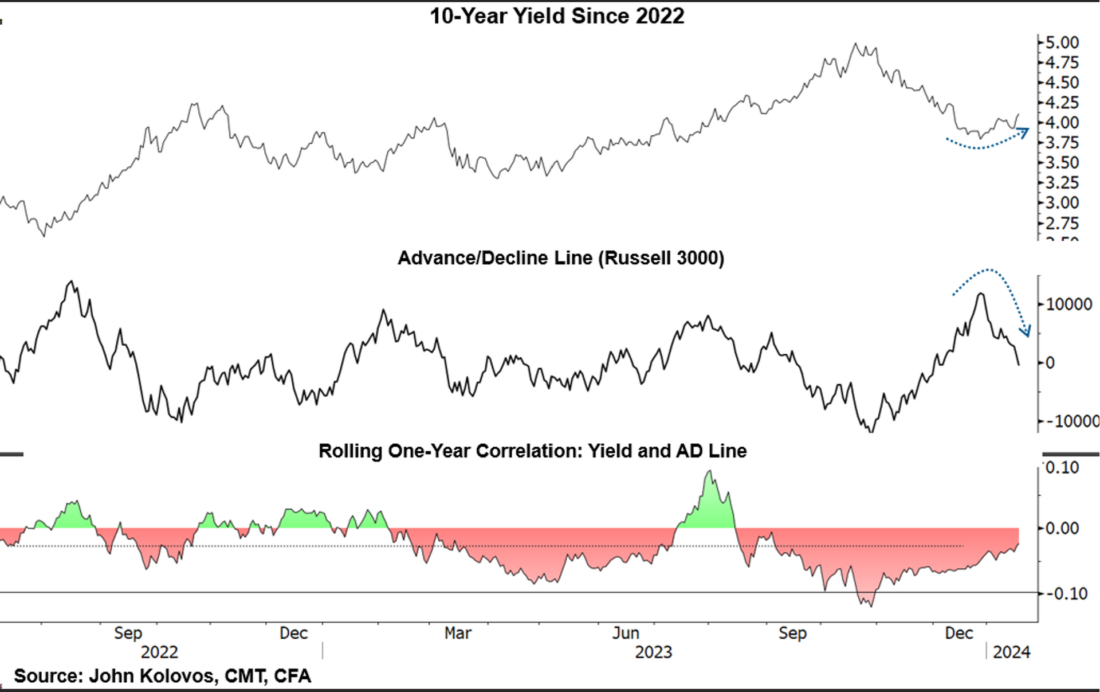
2/ Breadth and Rates Are Linked
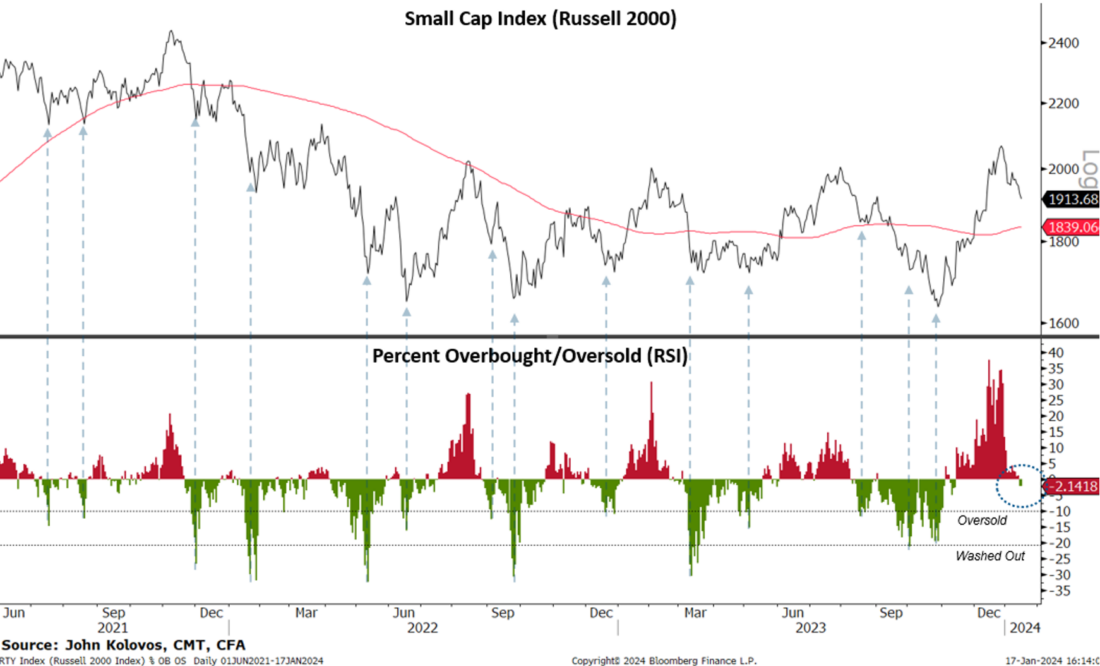
3/ Small Caps Testing Support but Are Not Yet Oversold
4/ New Highs Coming for USD/JPY?
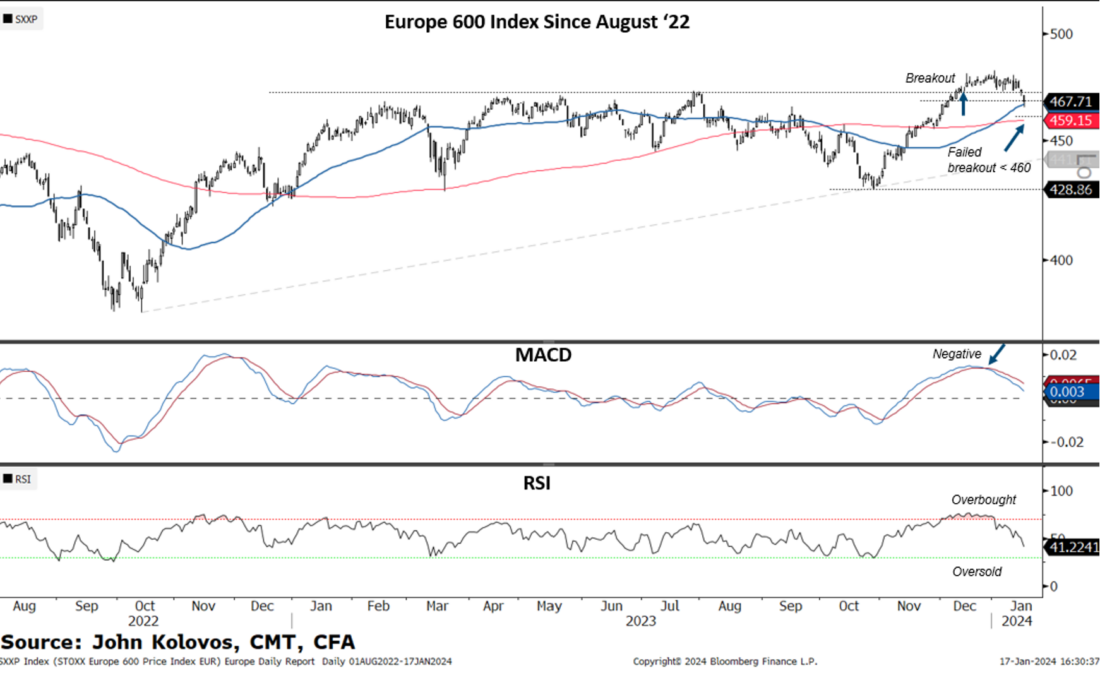
5/ Europe Consolidating to Trend Support
Investopedia is partnering with CMT Association on this newsletter. The contents of this newsletter are for informational and educational purposes only, however, and do not constitute investing advice. The guest authors, which may sell research to investors, and may trade or hold positions in securities mentioned herein do not represent the views of CMT Association or Investopedia. Please consult a financial advisor for investment recommendations and services.
1/ It Is OK to Be Bullish The S&P 500, But Not The Market of Stocks

Déjà vu all over again. Party like it’s 2023! Breadth is weakening again for the broad market, and it seems like we are heading back into the have’s vs the have-nots; mega-cap growth vs everything else. The Mag 7 vs the S&P 493. A big part of our market view last year was that it was OK to be bullish on the stock market (S&P 500) but not the market of stocks (Russell 3000). In fact, there was nothing really wrong with the S&P 500 last year, which carved out its bear market bottom in October ’21, and put in place a series of higher highs and higher lows after that. The uptrend was confirmed by the Advance-Decline Line, which recently made a new high. However, the broader equity complex remains longer-term challenged, as shown by the R3K AD Line. Notice the higher highs in the S&P 500’s AD Line, whereas the Russell 3000 has lower highs. This divergence does not have to be bearish per se, but it does mean being selective and tactical in stock selection/portfolio construction while making advances above and beyond ATHs on SPX vulnerable to idiosyncratic risk.
2/ Breadth and Rates Are Linked

We are being reminded again as we were for all of 2023, that interest rates and breadth are inversely related. Chart 2 shows the rolling correlation between the US 10-year Yield and the Russell 3000 AD Line. The broadening of the equity market in Q4 was based on a major Fed pivot that now appears to be in the process of being reevaluated. In turn, yields have bounced, and breadth has weakened. Safety is being sought at the mega-cap growth complex, and risk is being reduced in the part of the market that is most sensitive to inflation, rates, and a recession.
3/ Small Caps Testing Support but Are Not Yet Oversold

Small caps have taken the brunt of the abuse thus far in 2024, with a 9% drawdown since December 27th compared to 1.8% for the S&P 500. In yesterday’s Chart Advisor, we said that parabolic moves do not correct by going sideways, so the decline in the Russell 2000 is not too surprising and that support “should” kick in above $185, which is the 50 DMA and the 38.2% retracement of the October’23 advance on IWM. What is interesting to note is that the 10-year yield is testing resistance at its 50 DMA, but the percentage of stocks in the Russell 2000 that are oversold is not at levels consistent with a recovery. Just 5% have an RSI < 30. Historically, readings in excess are deemed oversold.
4/ New Highs Coming for USD/JPY?

A chart standout this year has been the acceleration higher from USD/JPY. The yen reached its weakest level in six weeks versus the dollar, while government bonds fell, and the US 10-year built value above 4%. The chart of USD/JPY shows a moderating uptrend, but from an Elliot Wave perspective, it is tracking a move to the 160 area. Worries about intervention and speculation of BOJ rate hikes may reduce the speed of JPY’s decline vs. the dollar, which is why we must see how strong resistance at the 149.50 area is treated in the coming weeks. If USD/JPY is approaching resistance, along with the US 10-Year Yield, then we should look for risk sentiment to improve. Let’s see.
5/ Europe Consolidating to Trend Support

The majority of the outliers on Wednesday, January 16th, were from overseas markets. Korea added to a disastrous month, down 2.5%. India, down over 2% on the heels of disappointing HDFC results, and fell over 8%. The Shanghai Composite was down over 2% to a multi-year low. FTSE 100 (UK) was down 1.5% or a -2.5 STDEV decline and sliced right through the 7500 support, still rangebound/tilted lower. As the chart shows, The Europe 600 Index touched 50 DMA support after a 1.2% decline, the worst day since October. The reversal of higher interest rates has forced a reset in global markets, too. Not only has breadth weakened in the US (see above comments), but global participation is wavering too.
—
Originally posted 18th January 2024
Disclosure: Investopedia
Investopedia.com: The comments, opinions and analyses expressed herein are for informational purposes only and should not be considered individual investment advice or recommendations to invest in any security or to adopt any investment strategy. While we believe the information provided herein is reliable, we do not warrant its accuracy or completeness. The views and strategies described on our content may not be suitable for all investors. Because market and economic conditions are subject to rapid change, all comments, opinions and analyses contained within our content are rendered as of the date of the posting and may change without notice. The material is not intended as a complete analysis of every material fact regarding any country, region, market, industry, investment or strategy. This information is intended for US residents only.
Disclosure: Interactive Brokers
Information posted on IBKR Campus that is provided by third-parties does NOT constitute a recommendation that you should contract for the services of that third party. Third-party participants who contribute to IBKR Campus are independent of Interactive Brokers and Interactive Brokers does not make any representations or warranties concerning the services offered, their past or future performance, or the accuracy of the information provided by the third party. Past performance is no guarantee of future results.
This material is from Investopedia and is being posted with its permission. The views expressed in this material are solely those of the author and/or Investopedia and Interactive Brokers is not endorsing or recommending any investment or trading discussed in the material. This material is not and should not be construed as an offer to buy or sell any security. It should not be construed as research or investment advice or a recommendation to buy, sell or hold any security or commodity. This material does not and is not intended to take into account the particular financial conditions, investment objectives or requirements of individual customers. Before acting on this material, you should consider whether it is suitable for your particular circumstances and, as necessary, seek professional advice.
Disclosure: Forex
There is a substantial risk of loss in foreign exchange trading. The settlement date of foreign exchange trades can vary due to time zone differences and bank holidays. When trading across foreign exchange markets, this may necessitate borrowing funds to settle foreign exchange trades. The interest rate on borrowed funds must be considered when computing the cost of trades across multiple markets.
Disclosure: ETFs
Any discussion or mention of an ETF is not to be construed as recommendation, promotion or solicitation. All investors should review and consider associated investment risks, charges and expenses of the investment company or fund prior to investing. Before acting on this material, you should consider whether it is suitable for your particular circumstances and, as necessary, seek professional advice.

