Production lifts again in Q2, FY25
ASX Release
Westgold is an agile ASX200 Australian gold company.
With six operating mines and combined processing capacity of ~7Mtpa across two of Western Australia’s most prolific gold regions – we have a clear vision and strategy to sustainably produce +500,000ozpa from FY26/27.
Financial values are reported in A$ unless otherwise specified
This announcement is authorised for release to the ASX by the Board.
PERTH, Western Australia, Jan. 23, 2025 /CNW/ – Westgold Resources Limited (ASX: WGX) (TSX:WGX) (Westgold or the Company) is pleased to report results for the period ending 31 December 2024 (Q2 FY25).
|
Highlights
OPERATIONS
Safety Performance Total Recordable Injury Frequency Rate |
||
|
Record gold production in Q2 FY25 of 80,886oz Au @ AISC of |
||
|
EXPLORATION & RESOURCE DEVELOPMENT
Seventeen drill rigs operating across portfolio |
||
|
Bluebird-South Junction Resource and Reserve grown to |
||
|
Starlight Mineral Resource grown by 91%, underpinning |
||
|
Impressive drill results from both the Murchison and Southern Goldfields:
|
||
|
CORPORATE
Ore purchase agreement signed with New Murchison Gold – set |
||
|
Balance sheet bolstered with additional A$200M corporate |
||
|
Closing cash, bullion, and liquid investments at 31 December 2024 of $152M |
||
|
Westgold remains 100% unhedged – offering full exposure to escalating gold price |
||
Westgold Managing Director and CEO Wayne Bramwell commented:
“Q2, FY25 was the first full quarter of Westgold stewardship of the Southern Goldfields assets. Outputs continue to lift with a record group gold production of 80,886oz – increasing net mine cash flows to $45M and funding the Company’s operational and growth capital requirements. Westgold also drew down $50M from the corporate facility during the period to balance the working capital requirements of our much larger business.
The FY25 strategy is to systematically reconfigure the larger portfolio to generate higher levels of free cashflow with capital investment in critical mine infrastructure at Beta Hunt and Bluebird-South Junction, and resource development drilling key to achieving this.
In the Southern Goldfields we have rapidly demonstrated the ability to lift mine outputs. We are investing for the next decade of operations at Beta Hunt with the key enablers to higher mine productivity including a clean mine water supply, upgrades to underground pumping, power, ventilation and facilities for our workforce. All of these projects are underway and on completion will set this mine up to consistently deliver >2Mtpa run rates during 2025.
In the Murchison, we are steadily expanding the Bluebird-South Junction mine to lift outputs to 1-1.5Mtpa run rates in 2025, ultimately sustaining the Bluebird mill from a single source. A change in ground support methodology to support the expansion and transition to a larger transverse open stoping mining method slowed the progress of this ramp up in Q2, and with those changes now implemented, Bluebird-South Junction mine output is increasing again.
Seventeen drill rigs are operational today. At South Junction, intersections such as 68.00m at 5.48g/t Au and 45.00m at 4.18g/t Au highlight the quality and thickness of the mineral endowment. At the Fletcher Zone, five rigs are operational, with highly encouraging results including 6.6m at 41.84g/t and 24.6m at 6.9g/t Au building our confidence in a third mining front.
Our strategic asset review commenced with the Fortnum scoping study defining a pathway to a higher margin, expanded 1.5Mtpa facility with a 10-year integrated mine plan. At Meekatharra we finalised an ore purchase agreement with a Murchison explorer that unlocks value for all shareholders and will provide a new softer feed source to our Bluebird mill in FY26.
Strong treasury management is key to delivering our strategy and providing returns to our shareholders. During the quarter Westgold expanded our corporate facility to $300M without mandatory hedging to support mine and process plant expansion plans as this investment will reduce operating cost and enhance future cashflows.
Building a simpler, yet larger scale and more profitable business requires investment and time.
Six months on post-merger, Westgold now has the portfolio that can deliver increased levels of free cash flow. Our capital investments are focussed on higher mine productivity and lowering our all in sustaining costs with the Group’s Q4, FY25 exit run rate the measure of our success.”
Executive Summary
Cash Position at 31 December 2024
Q2, FY25 was the first full quarter of Westgold stewardship of the Southern Goldfield assets.
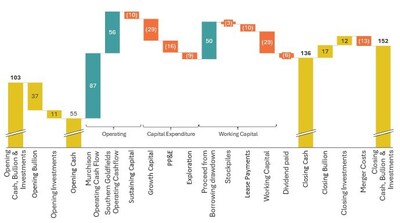
Westgold closed the quarter with cash, bullion and liquid investments of $152M (see Figure 1). This result was driven by record group gold production of 80,886oz, increasing net mine cash flows of $45M and funding the Company’s operational and growth capital requirements.
Westgold also draw down $50M from the corporate facility during the period to balance the working capital requirements of now, a much larger business.
Figure 1: Cash, Bullion, and Liquid Investments Movement (A$M) – Q2 FY25
Notes
- Merger costs of $13M relating to Karora Resources Inc’s North American advisor costs finalised in Q2.
- Dividend payment relates to payment of FY24 Final Dividend (declared 1.25 cent per share fully franked).
- Working capital movement of $29M reflects the timing of creditor payments.
- The draw down of $50M from the corporate facility provides prudent overall treasury management of a larger business.
Group Production Highlights – Q2 FY25
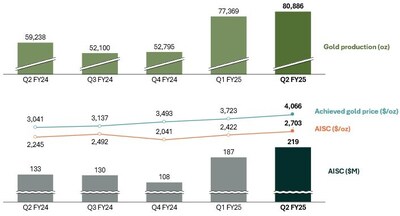
Westgold achieved its highest quarterly gold production in Q2 FY25, producing 80,886 ounces and generating $45M in net mine cashflow.
This included 46,461 ounces from the Murchison and 34,425 ounces from the Southern Goldfields. Notwithstanding the quarter-on-quarter improvement in ounces produced, the ramp up at the Bluebird-South Junction and Beta Hunt underground mines was slower than planned.
All-In Sustaining Cost (AISC) for the quarter was $2,703/oz (Q1 FY25 $2,422/oz). The elevated AISC $/oz in Q2 FY25 was due to lower than anticipated production from Bluebird-South Junction and Beta Hunt combined with the impact of absorbing a full quarter of Southern Goldfields operating costs.
Capital growth projects continued to advance across the Group in line with the current strategy to ramp up production in H2 FY25.
The Company sold 86,879oz of gold for the quarter achieving a record price of $4,066/oz, generating $353M in revenue. With Westgold free of any fixed forward sales contracts, the Company continues to offer shareholders full exposure to record spot gold prices.
Westgold’s operations generated $110M of mine operating cashflows with the achieved gold price $1,363/oz over AISC. AISC for Q2 FY25 of $219M (Q1 FY25 of $187M) including $32M in additional costs from the Southern Goldfields being under Westgold’s control for the first full quarter.
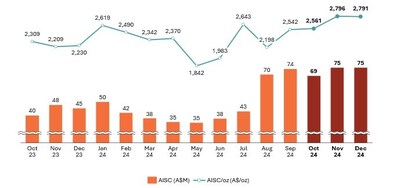
As illustrated in Figure 3 the monthly AISC since post-merger (August 2024) has been relatively consistent.
Capital expenditure during Q2 FY25 of $56M (Q1 FY25 $58M) includes $29M investment in growth projects (Bluebird-South Junction and the Great Fingall development), $27M upgrading processing facilities, infrastructure and equipment across the sites.
Investment in exploration and resource development of $9M (Q1 FY25 $14M) for the quarter was focussed on Bluebird-South Junction and Starlight in the Murchison, and the Fletcher Zone, Larkin Zone and Two Boys underground in the Southern Goldfields.
The net mine cash inflow for Q2 FY25 was $45M (refer Table 1 under Group Performance Metrics).
Environmental, Social and Governance (ESG)
People
People are a key enabler of operational productivity. Westgold is committed to investing in building organisation capability and lowering workforce turnover. Westgold’s continued focus on diversity and inclusion has been recognised at the AMEC Awards 2024, with Westgold celebrated as finalists for the Diversity and Inclusion Award. Respect in the Workplace training was rolled out to the business and a Respect Hotline was established as another avenue for the workforce to raise workplace concerns.
At the end of the quarter, Westgold employed 2,100 employees and contractors.
Safety and Sustainability
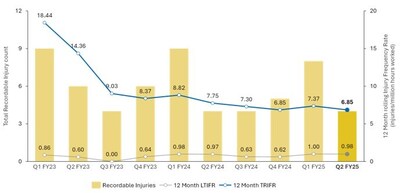
Westgold has maintained a strong focus on safety, resulting in continued positive trends across key performance indicators this quarter. The Total Recordable Injury Frequency Rate (TRIFR) decreased to 6.85 injuries per million hours worked, representing a 7.09% improvement quarter-on-quarter. The business recorded zero (0) Lost Time Injuries, resulting in a 3.52% decrease in the Lost Time Injury Frequency Rate (LTIFR) to 0.98. The High Potential Incident Rate (HiPR) increased from 5.18 to 6.09.
During this quarter, zero (0) Significant Environmental Incidents were recorded.
Group Performance Metrics
Westgold’s quarterly physical and financial outputs for Q2 FY25 are summarised below.
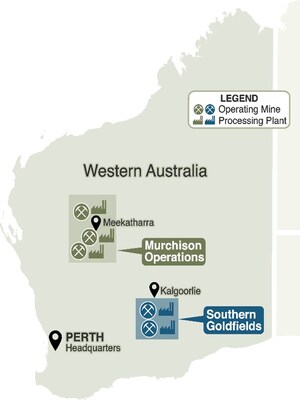
The Group operates across the Murchison and Southern Goldfields regions of Western Australia with the Murchison Operations incorporating four underground mines (Bluebird-South Junction, Starlight, Big Bell, and Fender) and three processing hubs (Fortnum, Tuckabianna and Bluebird).
Westgold’s merger with Karora Resources Inc completed on 1 August 2024. These assets are grouped and reported as Westgold’s Southern Goldfields operations – incorporating the Beta Hunt and Two Boys underground mines and two processing hubs (Higginsville and Lakewood).
|
Physical Summary |
Units |
Murchison |
Southern |
Group |
|
ROM – UG Ore Mined |
t |
664,568 |
450,555 |
1,115,123 |
|
UG Grade Mined |
g/t |
2.3 |
2.3 |
2.3 |
|
ROM – OP Ore Mined |
t |
– |
– |
– |
|
OP Grade Mined |
g/t |
– |
– |
– |
|
Ore Processed |
t |
749,182 |
592,823 |
1,342,005 |
|
Head Grade |
g/t |
2.1 |
2.0 |
2.1 |
|
Recovery |
% |
90 |
92 |
91 |
|
Gold Produced |
oz |
46,461 |
34,425 |
80,886 |
|
Gold Sold |
oz |
50,263 |
36,616 |
86,879 |
|
Achieved Gold Price |
A$/oz |
4,066 |
4,066 |
4,066 |
|
Cost Summary |
||||
|
Mining |
A$’M |
72 |
52 |
124 |
|
Processing |
A$’M |
32 |
24 |
56 |
|
Admin |
A$’M |
6 |
5 |
11 |
|
Stockpile Movements |
A$’M |
(6) |
3 |
(3) |
|
Royalties |
A$’M |
5 |
12 |
17 |
|
Cash Cost (produced oz) |
A$’M |
109 |
96 |
205 |
|
Corporate Costs |
A$’M |
3 |
1 |
4 |
|
Sustaining Capital |
A$’M |
7 |
3 |
10 |
|
All-in Sustaining Costs |
A$’M |
119 |
100 |
219 |
|
All-in Sustaining Costs |
A$/oz |
2,556 |
2,903 |
2,703 |
|
Notional Cashflow Summary |
||||
|
Notional Revenue (produced oz) |
A$’M |
189 |
140 |
329 |
|
All-in Sustaining Costs |
A$’M |
(119) |
(100) |
(219) |
|
Mine Operating Cashflow |
A$’M |
70 |
40 |
110 |
|
Growth Capital |
A$’M |
(26) |
(3) |
(29) |
|
Plant and Equipment |
A$’M |
(15) |
(12) |
(27) |
|
Exploration Spend |
A$’M |
(5) |
(4) |
(9) |
|
Net Mine Cashflow |
A$’M |
24 |
21 |
45 |
|
Net Mine Cashflow |
A$/oz |
509 |
605 |
554 |
Q2 FY25 Group Performance Overview
Westgold processed 1,342,005t (Q1 FY25 – 1,289,561t) of ore in total at an average grade of 2.1g/t Au (Q1 FY25 – 2.1g/t Au), producing 80,886oz of gold (Q1 FY25 – 77,369oz). Group AISC in Q2 FY25 was $219M (Q1 FY25 – $187M).
The $32M increase reflects the enlarged Westgold post-merger accounting for three months’ worth of production at the Southern Goldfields in comparison to two months in Q1 FY25.
MURCHISON
The Murchison operations produced 46,461oz of gold (Q1 FY25 – 52,889oz), largely as a result of lower production from the Bluebird-South Junction mine and reduced access to low grade stockpiles.
Total AISC of $119M was in line with the prior quarter (Q1 AISC – $121M). Total AISC continues to trend down against historical average quarterly AISC, demonstrating the effectiveness of Westgold’s cost optimisation and focus on profitability. Mining costs in the Murchison operations were $1,549/oz (Q1 FY25 $1,074/oz) coinciding with additional costs to re-establish access to remnant mining areas at Big Bell being offset by lower sustaining capital requirements. In addition, a revision to ground support requirements in the South Junction area of the Bluebird-South Junction mine, slowed production from South Junction and resulted in increased ground support costs for this quarter.
Total Capital expenditure of $41M, included Growth Capital ($26M) and Plant and Equipment ($15M) across the Murchison operations. Growth Capital related to the Great Fingall development and expansions to the Bluebird-South Junction and Starlight mines.
Plant and Equipment capital includes investment related to processing facilities ($6M), Bluebird-South Junction primary ventilation fans ($3M) and Bluebird paste plant ($2M) during the quarter.
SOUTHERN GOLDFIELDS
Q2 represents the first full quarter of operation under Westgold’s ownership. The Southern Goldfields production continued to increase, delivering 34,425oz of gold (Q1 FY25 – 24,480oz).
The additional month’s operation resulted in increased total AISC in the Southern Operations quarter on quarter (Q2 AISC – $100M vs Q1 ASIC – $65M). On a per ounce basis, AISC was higher at $2,903/oz (Q1 AISC – $2,696/oz) as a result of production being impacted due to a bearing failure on a primary ventilation fan and a burst rising main (impacting pumping) at Beta Hunt.
Produced ounces were under budget due to lower grades seen in development tonnage and smaller content of coarse gold from the A Zone lode at Beta Hunt. Grade reconciliation was an issue with the inherited resource model now being populated with a backlog of drill data left from the previous operators and new drill data from the latest Westgold drilling.
Total Capital Expenditure of $15M, included Growth Capital ($3M) and Plant and Equipment ($12M) across the Southern Goldfields operations relating to Beta Hunt mine, processing facilities and underground equipment.
Table 2: Q2 FY25 Group Mining Physicals
|
Ore Mined |
Mined Grade |
Contained ounces |
|
|
Murchison |
|||
|
Bluebird |
88 |
3.42 |
9,649 |
|
Fender |
76 |
2.26 |
5,531 |
|
Big Bell |
333 |
1.81 |
19,338 |
|
Starlight |
168 |
2.67 |
14,374 |
|
Southern Goldfields |
|||
|
Beta Hunt |
407 |
2.26 |
29,555 |
|
Two Boys |
44 |
2.22 |
3,125 |
|
GROUP |
1,115 |
2.28 |
81,571 |
Table 3: Q2 FY25 Group Processing Physicals
|
Ore Milled |
Head Grade |
Recovery |
Gold Production |
|
|
Murchison |
||||
|
Bluebird |
89 |
3.38 |
93 |
8,982 |
|
Fender |
64 |
2.13 |
85 |
3,757 |
|
Open Pit & Low Grade1 |
66 |
1.22 |
85 |
2,194 |
|
Bluebird Hub |
219 |
2.36 |
89 |
14,933 |
|
Big Bell |
301 |
1.86 |
87 |
15,609 |
|
Open Pit & Low Grade |
21 |
0.69 |
86 |
402 |
|
Tuckabianna Hub |
322 |
1.78 |
87 |
16,011 |
|
Starlight |
167 |
2.82 |
95 |
14,364 |
|
Open Pit & Low Grade |
41 |
0.94 |
95 |
1,153 |
|
Fortnum Hub |
208 |
2.46 |
95 |
15,517 |
|
Southern Goldfields |
||||
|
Beta Hunt |
247 |
2.31 |
92 |
16,896 |
|
Lakewood Hub |
247 |
2.31 |
92 |
16,896 |
|
Beta Hunt |
167 |
2.26 |
92 |
11,107 |
|
Two Boys |
52 |
2.28 |
92 |
3,470 |
|
Pioneer OP |
2 |
2.21 |
92 |
155 |
|
Open Pit & Low Grade |
125 |
0.78 |
92 |
2,797 |
|
Higginsville Hub |
346 |
1.72 |
92 |
17,529 |
|
GROUP TOTAL |
1,342 |
2.06 |
91 |
80,886 |
|
1 |
Includes low grade ore mined at Big Bell and trucked to Bluebird |
Operations Summary
Murchison
- Bluebird-South Junction Underground Mine (Meekatharra)
The production ramp-up at Bluebird-South Junction ended Q1 in line with planned throughput rates and poised to commence substantial stoping operations at South Junction. In October updated geotechnical modelling highlighted the need to enhance ground support for both existing and new development drives in South Junction to support the expansion and transition to a larger transverse open stoping mining method.
While this required additional resources and temporarily slowed production ramp-up during Q2 FY25, the enhanced ground support management plan – which is not dissimilar to ground support used in other Westgold mines – is not expected to materially impact steady state mining rates or anticipated mining costs going forward.
By December, full access was restored to the South Junction mining fronts and production momentum regained. The planned 1.2Mtpa run rate is now expected to be achieved in late Q4.
In conjunction with the expansion in mining rates, project works remain on track for underground HV electrical upgrades, primary ventilation upgrades and paste fill infrastructure. The completion of these projects will ensure sustained production growth from South Junction.
- Bluebird Mill (Meekatharra)
Lower than anticipated production at Bluebird-South Junction and lower production at Fender in November (see section below for details) constrained ore supply to the Bluebird mill. As a result, the Bluebird mill operated at reduced capacity during Q2.
However, this situation created a valuable opportunity to address legacy maintenance issues. These items including screening upgrade, tankage repairs and reline, elution circuit upgrade and structural repairs where completed, ensuring enhanced availability and reliability as Bluebird-South Junction progresses toward its ramp-up to 1.2Mtpa.
- Fender Underground Mine (Cue)
Production at Fender had a strong start to the quarter, achieving record production in October. A severe, yet localised rainfall event in November temporarily impacted critical underground dewatering infrastructure. Production returned to steady levels in December, with substantial works completed to enhance surface flood protection.
Looking ahead to Q3, the focus will be advancing the Fender decline to access the next level in the sequence, positioning the mine for sustained steady state production.
- Big Bell Underground Mine (Cue)
Production from the cave increased compared to the previous quarter due to commencement of remnant cave mining, averaging 110kt per month, with a record production month achieved in December. A scoping study was completed early in Q2 on mining remnant areas of the cave, with the study identifying low-cost production that could be mined from remnant drawpoints between the 320 and 585 levels.
Efforts to re-establish access to the remnant drawpoints commenced in the upper levels of the cave with some remnants being mined during the quarter and setting the stage to commence increased levels of bogging activity in Q3.
The ability to mine remnants in the upper areas of the cave has insured continued ore availability when combined with the ore from the cave bottom. This has allowed Westgold to defer the development of the long hole open stoping mine in the Big Bell Deeps and prioritise the Bluebird-South Junction and Beta Hunt mine expansions.
This deferral is expected to reduce capital expenditure in FY25 by up to $20M.
- Great Fingall Underground Mine (Cue)
The development of the Great Fingall project made strong progress during the quarter, with development advancing as planned.
The establishment of the Life-of-Mine (LOM) infrastructure is progressing smoothly, with preparations underway for the installation of an upgraded primary ventilation fan in early Q3. This upgrade will support the continued growth of the mine and ensure adequate ventilation to meet production demands.
Furthermore, the upgrade to the dewatering infrastructure is on track, with a new rising main being drilled to support the installation of a new pump station on the 1660 level.
Early Mining Opportunity
Over the last year, Westgold investigated the possibility of mining flat lying structures in the vicinity of the existing Great Fingall Open Pit, collectively termed the Fingall Flats. A drilling program of the Fingall Flats, completed in Q4 FY24, provided confidence that the grade and distribution of gold warranted further development of a mine plan which would enable extraction.
Westgold has completed substantial work derisking the mining of this ore which daylights into the exiting pit walls and contacts historical mine development. Higher than anticipated complexity of the derisking work delayed production expectations from H1 into H2 FY25.
With this work now completed, Westgold have built a robust mine plan that sees the development of bulk stopes to recover Great Fingall Flats ore, with mining to commence in late-Q3 FY25 following the completion of ore drives during Q2.
These early, bulk stopes are expected to substantially reduce execution risk and increase recoverability of the ore whilst optimising operating costs. It is expected that over 100kt of ore can be mined from this source at a mined grade of ~1.3-1.7g/t and rate of approximate 20kt/month as a precursor to accessing the higher grade, virgin stopes from Q4 FY25.
- Tuckabianna Processing Hub (Cue)
Big Bell underground ore was the primary source of ore feed to the Tuckabianna processing hub, with throughput remaining steady at 107kt per month and recovery at 87%. The plant experienced minimal unplanned downtime during the quarter, with the planned mill reline completed in November.
Construction of the Tuckabianna West in-pit tailings storage facility is progressing well, with planned completion set for early Q3. Earthworks, piping, and power line installation have been successfully completed according to plan. Once completed, the facility will secure 8 years of tailings storage capacity.
- Starlight Underground Mine (Fortnum)
Production and grade from Starlight continue to exceed expectations, with the 1095 level development yielding high-grade ore, significantly boosting Starlight’s production output for the quarter. Production continues in Nightfall on the 1140 and 1160 levels, as well as in Starlight on the 865 level.
Progress on the ventilation upgrade is moving forward smoothly, with the development of a new vent portal completed during the quarter. The planned upgrade of primary fans in Q3 will further support the mine’s expansion into the Nightfall area.
- Fortnum Processing Hub (Fortnum)
Starlight underground material contributed 90% of the ore feed to the Fortnum processing hub, with the remaining 10% sourced from low-grade stockpiles. In November, the processing plant achieved its highest throughput since May 2020, processing 73kt of ore. Planned maintenance during the quarter included a full reline of both the Ball and SAG mills.
Additionally, the completion of the TSF2 Cell 2 lift to 518mRL in November provided increased tailings storage capacity.
Southern Goldfields
- Beta Hunt Underground Mine (Kambalda)
Beta Hunt had a strong start to the quarter, achieving a record in October with ore production of 161kt (1.9Mt annualised rate), and the fifth highest monthly mined ounces on record, totalling 11.2koz. This strong performance was supported by operational improvements, including enhanced manning levels and surface remoting over shift changes, highlighting Beta Hunt’s potential to achieve a 2Mtpa production rate.
In November and December, production was impacted by ventilation restrictions due to a bearing failure on the primary fan and a burst rising main. These issues hindered production output and impeded capital development progress, delaying access to additional production fronts in the A-Zone and Western Flanks.
Westgold is in the process of updating resource models and establishing 24-hour geology support at Beta Hunt, after an internal study identified these as key drivers for grade underperformance against plan. Despite substantial drilling having been completed across Western Flanks and A-zone, the inherited Beta Hunt resource models excluded substantial infill definition data, causing poor grade reconciliation.
This data is being incorporated into current resource models as a priority, with the work expected to be completed in January 2025. The lack of 24-hour geology coverage underground has been identified as the primary driver a poor spatial compliance at Beta Hunt to plan, resulting in increased ore dilution.
Another key driver for lower than planned Beta Hunt grade was the lack of anticipated coarse gold presentation in ore, which until as recently as last year, was predictably found in accordance with Karora’s models.
Despite these challenges, Beta Hunt continues to demonstrate strong production potential. The focus moving into Q3 will be on addressing key operational challenges, including resolving ventilation constraints and upgrading underground water supply and dewatering infrastructure, ensuring Beta Hunt is set up for growth and sustained efficiency.
- Lakewood Processing Hub (Kalgoorlie)
Beta Hunt underground material served as the primary ore feed for the 1.2Mtpa Lakewood Mill at Kalgoorlie, continuing to support the mill’s operations effectively.
Lakewood processing achieved strong throughput for the quarter, meeting forecasted throughput levels despite a setback caused by the premature failure of a ball mill discharge grate. The issue was promptly addressed, and sustained high throughput helped mitigate the impact of this downtime.
Construction of a new Tailings Facility cell was successfully completed during the quarter, further enhancing the site’s tailings management capacity.
- Two Boys Underground Mine (Higginsville)
Production from the Two Boys underground mine remains steady, demonstrating consistent performance. The development of the ML70 diamond drill drive was successfully completed during the quarter, and grade control drilling has now commenced.
Fourteen holes have been completed as part of Westgold’s first drilling program, with assays from three of these holes indicating a potential extension to the life of mine. This positive result enhances the outlook for continued production and further resource potential.
- Higginsville Processing Hub (Higginsville)
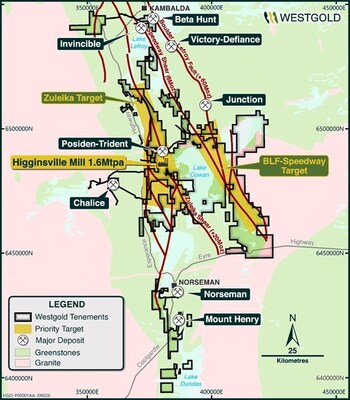
The 1.6Mtpa Higginsville processing plant currently relies on Two Boys underground and surplus Beta Hunt underground ore as its primary ore feed sources. During the quarter, the mill head grade was slightly below forecast due to increased low grade stockpile blending with lower ore supply from both mines.
The Chalice return water system experienced multiple pump failures, leading to a temporary reduction in plant availability. In response, significant resources have been allocated to improving the reliability of the return water system to minimise future disruptions and optimise plant performance.
The TSF 2-4 Stage 4 lift is progressing as planned and remains on track for completion in early Q3. Looking ahead, the primary focus will be on enhancing the reliability of the Chalice return water system and completing the TSF lift to further support ongoing plant efficiency.
Exploration and Resource Development
Westgold continues to invest in exploration and resource development across the Company’s highly prospective tenement portfolio. Key activities have been summarised in this section.
Murchison
RESOURCE DEVELOPMENT ACTIVITIES
Starlight (Fortnum)
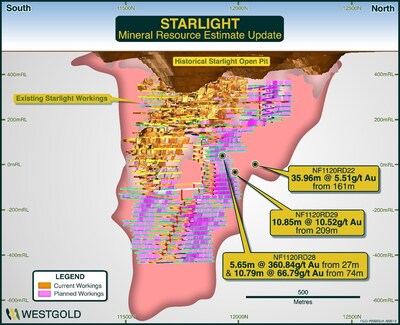
The Nightfall lode has driven the recent period of elevated performance at Fortnum, and thus the site has continued to focus resources to this orebody. Drilling has continued to define this high-grade area ahead of the mining front to ensure maximum extraction of value for the operation. Better results from resource definition work returned this quarter include:
- 35.96m at 5.51 g/t Au from 161m in NF1120RD22;
- 5.65m at 360.84 g/t Au from 27m and 10.79m at 66.79 g/t Au from 74m in NF1120RD28; and
- 10.85m at 10.52 g/t Au from 209m in NF1120RD29.
During the quarter, a significant Mineral Resource Estimate upgrade was released for Starlight (refer ASX 13 November 2024 – Starlight Mineral Resource Grows by 91%) which now stands at 12.9Mt at 2.7g/t Au for 1.13Moz of gold – a 91% increase on the June 2024 Starlight Mineral Resource Estimate. The expanded Mineral Resource Estimate is the product of concerted investment in resource definition drilling over a 2-year period and features a newly defined Open Pit Mineral Resource Estimate of 4.2Mt at 2.2g/t au for 290koz.
The updated Mineral Resources Estimate subsequently underpinned a Scoping Study detailing an expanded Fortnum Gold Operation featuring an increased milling rate of 1.5Mtpa over a ten-year life (refer ASX 17 December 2024 – Fortnum Expansion Study).
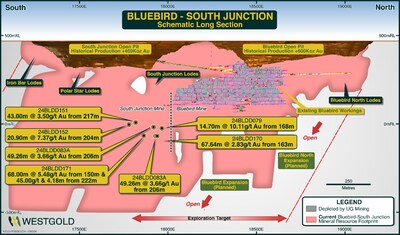
Westgold’s significant and ongoing investment in surface and underground drilling at Bluebird-South Junction was rewarded this quarter with the announcement of a 65% increase in Measured and Indicated Resources on the June 2024 Mineral Resource Estimate, contributing to a total Bluebird-South Junction Mineral Resource Estimate of 1.4Moz (refer ASX 18 November 2024 – Bluebird-South Junction Mineral Resource Grows to 1.4Moz). This figure represents a 240% growth in the Mineral Resource Estimate post mining depletion over an 18-month period.
The Mineral Resource Estimate increase led to a doubling of the Ore Reserve for the project, which now stands at 7.2Mt at 2.5g/t Au for 573koz (refer ASX 4 December 2024 – Westgold Doubles Bluebird-South Junction Ore Reserve).
Westgold intends to maintain this trajectory of growth at Bluebird-South Junction, with drilling continuing on both surface and underground with four rigs active during the quarter. Better results returned from this work include the following spectacular infill intersections at South Junction:
- 68.00m at 5.48g/t Au from 150m in 24BLDD171;
- 67.64m at 2.83g/t Au from 163m in 24BLDD170;
- 45.00m at 4.18g/t Au from 222m in 24BLDD171;
- 49.26m at 3.66g/t Au from 206m in 24BLDD083A;
- 14.70m at 10.11g/t Au from 168m in 24BLDD079;
- 43.00m at 3.50g/t Au from 217m in 24BLDD151; and
- 20.90m at 7.37g/t Au from 204m in 24BLDD152.
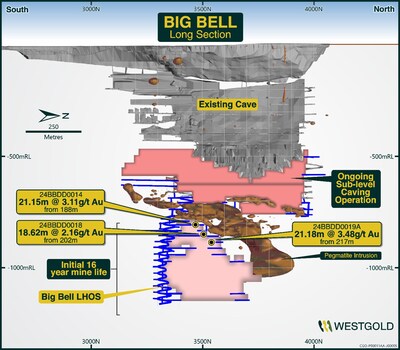
Big Bell (Cue)
Resource drilling at Big Bell remains ongoing, progressively providing improved definition within the broader mine plan. Better results returned this quarter include:
- 21.15m at 3.11g/t Au from 188m in 24BBDD0014;
- 18.62m at 2.16g/t Au from 202m in 24BBDD0018; and
- 21.18m at 3.48g/t Au from 217m in 24BBDD0019A.
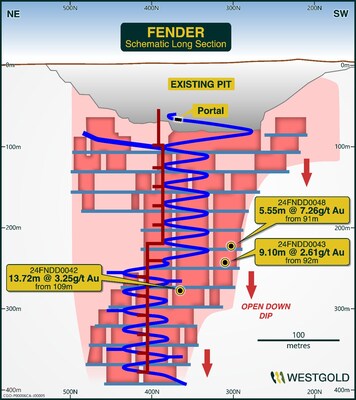
Fender (Cue)
Some broader-scale intervals were encountered from drilling conducted this quarter, which will provide incremental upside against the current mine plan. Better results from this work include:
- 13.72m at 3.25g/t Au 109m in 24FNDD0042;
- 9.10m at 2.61g/t Au 92m in 24FNDD0043; and
- 5.55m at 7.26g/t Au 91m in 24FNDD0048.
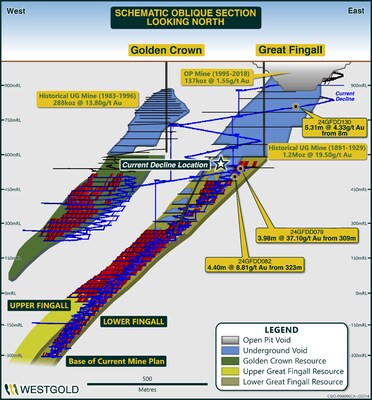
Great Fingall (Cue)
Diamond drilling recommenced at Great Fingall this quarter from underground, with activities targeting first ore horizons within both the Great Fingall and Golden Crown Reefs, resource extensions, exploration targets at Great Fingall and grade control activities within the Great Fingall Flats subsequent to ore development activities being completed on the 1850 Level.
Grade control modelling to allow stope design on the 1850 is progressing, and immediately following this geotechnical modelling to understand stope stability and pit wall exposures will be completed which will allow production in this area to commence early Q3 FY25.
Some of the better results returned by drilling at Great Fingall this quarter include:
- 3.98m at 37.10g/t Au from 309m in 24GFDD079;
- 4.4m at 8.81g/t Au from 323m in 24GFDD082; and
- 5.31m at 4.33g/t Au from 8m in 24GFDD130.
Progress was also made this quarter in terms of evaluating large-scale open pit opportunities in the Cuddingwarra area. A district-scale resource model amalgamation exercise was completed by specialist mining consultancy. Evaluation works on this model are scheduled to commence in coming quarter.
GREENFIELDS ACTIVITIES
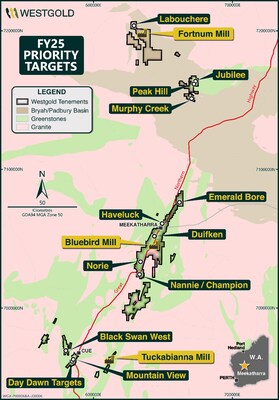
Greenfields activities in the Murchison included 5,787m of reverse circulation (RC) drilling testing the Mt View target at Day Dawn (Cue), the Champion target at Nannine (Meekatharra) and the Five Ways targets at Peak Hill (Fortnum).
The Mt View program was testing the historic Mt View reef system located proximal to the Great Fingall Reef which is currently under development by the Company. Assay results returned some encouragement including 2.00m @ 47.93g/t Au in hole 24GCRC04, 3.00m @ 2.34g/t Au in hole 24GCRC039 and 3.00m @ 1.85g/t Au in hole 24GCRC034. Further assessment of the results and potential follow-up planning is underway.
The Champion RC drilling program was testing the historic Champion Reef system which is the northern extension of the Caledonian system at Nannine.
This program successfully intersected the reef in all holes with some encouraging results including 8.00m @ 5.05g/t Au in hole 24NNRC001, 3.00m @ 3.53g/t Au in hole 24NNRC008 and 4.00m @ 2.74g/t Au in hole 24NNRC013.
The Peak Hill RC program only commenced during December and no results have been returned as yet.
In addition to the new RC drilling programs, the assay results of the early stage aircore (AC) drilling program completed at Labouchere (Fortnum) last quarter were finalised with some significant encouragement including 3.00m @ 6.07g/t Au in hole 24LBAC044, 5.00m @ 2.07g/t Au in hole 24LBAC079 and 3.00m @ 0.73g/t Au in hole 24BLAC029. Follow-up RC drilling programs are in planning for the March quarter.
Southern Goldfields
RESOURCE DEVELOPMENT ACTIVITIES
Westgold is continuing to work through legacy infrastructure constraints to increase the rate of geological data capture at Beta Hunt. The number of rigs available on site has increased to seven, with the Company remaining focused on acquiring enough data to enable a Maiden Mineral Resource Estimate to be undertaken for the Flecher zone in the soonest possible timeframe.
To this end, initial results from the Westgold Fletcher drilling campaign have been returned with better results including:
- 6.6m at 41.84g/t Au from 516m in WF440N1-05AE;
- 31m at 5.63g/t Au from 228m in WF440VD-54AE; and
- 24.6m at 6.9g/t Au from 274m in WF440VD-55AE.
Resource development work elsewhere in the mine has also returned some impressive results during the quarter, with the drilling currently underway in the Larkin zone. Better results returned form drilling at Larkin this quarter include:
- 18.5m at 6.76g/t Au from 119m in LL320-07AG;
- 2m at 30.6g/t Au from 105m in LL395INC-07AR; and
- 14.85m at 3.61g/t Au from 165m in LL395INC-11AR
Higginsville
The first drill platform at the Two Boys underground operation was completed during the quarter, allowing resource extension drilling activities to subsequently commence. It is envisaged that this initial Westgold drill program at Two Boys will continue for the bulk of Q3 FY25, with the results allowing Westgold to solidify the Two Boys mine plan.
At Lake Cowan, resource definition drilling at Atreides and Harkonnen was completed. Subsequently, drilling activities progressed onto grade control works which were ongoing at quarter’s end. It is envisaged that grade control drilling will be concluded in mid-January, allowing a resumption of open mining activity in Higginsville prior to the end of Q3 FY25. Better results returned from this resource development work include:
- 4m at 6.52g/t Au from 17m in KHKRC0046;
- 18m at 1.54g/t Au from 27m in KHKRC0047; and
- 4m at 10.57g/t Au from 10m in KHKRC0075.
Initial evaluation and mine planning studies were completed on the southern Higginsville Line of Lode underground targets. Although these studies are preliminary, the metrics generated were sufficiently encouraging to allow Westgold to contemplate a first phase of resource drilling. This drilling will be planned over the coming months and is expected to commence following the completion of the first phase of drilling at Two Boys.
GREENFIELDS ACTIVITIES
Greenfields activities in the Southern Goldfields region continued with a focus on the development of accelerated exploration plans for both Beta Hunt and the Higginsville region with planning, target reviews and the ongoing development of drilling programs undertaken during the quarter.
In addition to the target generation works, 20 RC holes for 4,021m were drilled testing the Erin and Bandido targets and 2 diamond core holes of 480m were drilled at the Erin target. Erin and Bandido are located proximal to the Higginsville mill. Assay results for these holes had not been received at the end of the quarter.
Greenfields targeting at Beta Hunt accelerated during the period with the construction of a new 3D Exploration model for the entire sub-lease area. This model will become the key targeting tool for new discoveries proximal to the existing mining operations. The southeast extension of the Mason system has been identified as the priority target with program drill design underway.
Corporate
At the end of Q2 FY25, Westgold’s total cash, bullion and investments totalled $152M.
Cash, Bullion and Investments
|
Description |
Sep 2024 |
Dec 2024 |
Variance |
Variance |
|
Cash |
55 |
123 |
68 |
124 |
|
Bullion |
37 |
17 |
(20) |
(54) |
|
Investments |
11 |
12 |
1 |
9 |
|
Cash and Bullion |
103 |
152 |
49 |
48 |
Debt
On 28 October 2024 Westgold announced it had executed a commitment letter with its existing lenders to increase its $100M Syndicated Facility Agreement to $300M through the addition of a new $200M facility. The new $200M facility strengthens the Company’s balance sheet by providing access to a total of $300M of facilities that may be utilised for general corporate purposes.
At quarter end Westgold had drawn down $50M from its Corporate Facilities to balance the working capital requirements for operations and growth of a much larger business. This leaves a balance of $250M in undrawn capacity. Combined with its cash balance of $152M, the Company had at the end of the quarter, $402M in available liquidity.
The Company has equipment financing arrangements on acquired plant and equipment under normal commercial terms with expected repayments of approximately $44M for the financial year.
Gold Hedging
Westgold is fully unhedged and completely leveraged to the gold price with an achieved gold price of $4,066/oz for Q2 FY25 (Q1 FY25 $3,723/oz).
Synergies
The table below identifies the post-merger pre-tax synergies which have been realised to date. Work to realise further savings continue with substantial opportunities having been already identified and expected to be delivered over the next year.
|
Pre-tax Synergies |
Realised savings ($M/annum) |
|
Corporate Management |
21 |
|
Professional Services |
2 |
|
Commercial contracts |
5 |
|
Total realised savings to date |
28 |
Strategic Review – Fortnum Expansion Scoping Study
The merger with Karora has created the opportunity to review all assets within Westgold’s expanded portfolio. This review commenced in the prior quarter, and in the current quarter, it delivered a scoping study outlining the potential for an expansion of the Fortnum Gold Operation, located 140km north of Meekatharra[2].
The study outlines a 10-year integrated mine plan, including the Starlight, Nathan’s, and Yarlarweelor open pits, and an expansion of the existing Starlight underground operation. The updated Mineral Resource Estimate for Starlight is now 12.9Mt at 2.7g/t Au for 1.13Moz, a 91% increase from previous estimates.
Key highlights of the Study include:
- Mill expansion: From 0.9Mtpa to 1.5Mtpa.
- Life of Mine (LOM) gold production: 713koz – 871koz at an All-In Sustaining Cost (AISC) range of $1,404 – $2,916/oz.
- Financial metrics: Mid-point NPV₈ of $306M at $3,500/oz gold price, increasing to $498M at $4,000/oz; mid-point free cash flow of $777M at $3,500/oz, rising to $1.2B at $4,000/oz.
- Capital investment: Approximately $294M over the LOM, with modest upfront capital costs.
The study indicates that the Fortnum Expansion Project is financially viable and materially derisked, with plans to advance drilling and evaluation to support a Final Investment Decision within 12 months.
Crown Prince Ore Purchase
On 12 December 2024, Westgold announced a gold ore purchase agreement with Zeus Mining Pty Ltd, a subsidiary of New Murchison Gold Limited (NMG). This agreement, pending NMG shareholder approval, involves Westgold purchasing 30,000 to 50,000 tonnes of gold ore per month from NMG’s Crown Prince open pit operation, starting mid-2025. The ore will be processed at Westgold’s Bluebird plant, increasing production and reducing costs at the operation.
This collaboration is expected to benefit both companies by leveraging existing infrastructure and unlocking value for NMG shareholders without the need for additional capital investment. The initial term of the agreement is two years, with potential extensions on a quarterly basis.
OTCQX trading
In August 2024, Westgold commenced trading on the TSX, providing North American investors unprecedented access to Westgold securities. With the TSX listing well established, Westgold has elected to discontinue trading on the OTCQX Best Market, resulting in its WGXRF securities recommencing trading on the Pink market.
Share Capital
Westgold closed the quarter with the following capital structure:
|
Security Type |
Number on Issue |
|
Fully Paid Ordinary Shares |
943,109,690 |
|
Performance Rights (Rights) |
9,209,727 |
|
2 |
Refer to ASX announcement titled “Fortnum Expansion Study” – 17 December 2024 |
Compliance Statements
Exploration Targets, Exploration Results, Mineral Resources and Ore Reserves
The information in this report that relates to Mineral Resources is compiled by Westgold technical employees and contractors under the supervision of GM Technical Services, Mr. Jake Russell B.Sc. (Hons), who is a member of the Australian Institute of Geoscientists and who has verified, reviewed, and approved such information. Mr Russell is a full-time employee to the Company and has sufficient experience which is relevant to the styles of mineralisation and types of deposit under consideration and to the activities which he is undertaking to qualify as a Competent Person as defined in the 2012 Edition of the Australasian Code for Reporting of Exploration Results, Mineral Resources and Ore Reserves (the “JORC Code“) and as a Qualified Person as defined in the CIM Guidelines and National Instrument 43-101 – Standards of Disclosure for Mineral Projects (“NI 43-101“). Mr. Russell is an employee of the Company and, accordingly, is not independent for purposes of NI 43-101. Mr Russell consents to and approves the inclusion in this report of the matters based on his information in the form and context in which it appears. Mr Russell is eligible to participate in short- and long-term incentive plans of the Company.
The information in this report that relates to Ore Reserve Estimates is based on information compiled by Mr. Leigh Devlin, B. Eng MAusIMM, who has verified, reviewed and approved such information. Mr. Devlin has sufficient experience which is relevant to the styles of mineralisation and types of deposit under consideration and to the activities which they are undertaking to qualify as a Competent Person as defined in the JORC Code and as a Qualified Person as defined in the CIM Guidelines and NI 43-101. Mr. Devlin is an employee of the Company and, accordingly, is not independent for purposes of NI 43-101. Mr. Devlin consents to and approves the inclusion in this report of the matters based on his information in the form and context in which it appears. Mr. Devlin is a full time senior executive of the Company and is eligible to, and may participate in short-term and long-term incentive plans of the Company as disclosed in its annual reports and disclosure documents.
The information in this report that relates to Exploration Targets and Results is compiled by the Westgold Exploration Team under the supervision of Chief Growth Officer, Mr. Simon Rigby B.Sc. (Hons), who is a member of the Australian Institute of Geoscientists and who has verified, reviewed, and approved such information. Mr Rigby is a full-time employee of the Company and has sufficient experience which is relevant to the styles of mineralisation and types of deposit under consideration and to the activities which he is undertaking to qualify as a Competent Person as defined in the JORC Code and as a Qualified Person as defined in the CIM Guidelines and NI 43-101. Mr. Rigby is an employee of the Company and, accordingly, is not independent for purposes of NI 43-101. Mr Rigby consents to and approves the inclusion in this report of the matters based on his information in the form and context in which it appears. Mr Rigby is eligible to participate in short-term and long-term incentive plans of the Company.
Mineral Resources, Ore Reserve Estimates and Exploration Targets and Results are calculated in accordance with the JORC Code. The other technical and scientific information in this report has been prepared in accordance with the Canadian regulatory requirements set out in NI 43-101 and has been reviewed on behalf of the company by Qualified Persons, as set forth above.
Technical reports
NI 43-101 compliant technical reports for each of Fortnum, Meekatharra, Cue, Beta Hunt and Higginsville operations are available under the Company’s SEDAR+ profile at www.sedarplus.ca and the Company’s website at www.westgold.com.au.
Forward Looking Statements
These materials prepared by Westgold Resources Limited (or the “Company“) include forward looking statements. Often, but not always, forward looking statements can generally be identified by the use of forward looking words such as “may”, “will”, “expect”, “intend”, “believe”, “forecast”, “predict”, “plan”, “estimate”, “anticipate”, “continue”, and “guidance”, or other similar words and may include, without limitation, statements regarding plans, strategies and objectives of management, anticipated production or construction commencement dates and expected costs or production outputs.
Forward looking statements inherently involve known and unknown risks, uncertainties and other factors that may cause the Company’s actual results, performance, and achievements to differ materially from any future results, performance, or achievements. Relevant factors may include, but are not limited to, changes in commodity prices, foreign exchange fluctuations and general economic conditions, increased costs and demand for production inputs, the speculative nature of exploration and project development, including the risks of obtaining necessary licenses and permits and diminishing quantities or grades of reserves, political and social risks, changes to the regulatory framework within which the Company operates or may in the future operate, environmental conditions including extreme weather conditions, recruitment and retention of personnel, industrial relations issues and litigation.
Forward looking statements are based on the Company and its management’s good faith assumptions relating to the financial, market, regulatory and other relevant environments that will exist and affect the Company’s business and operations in the future. The Company does not give any assurance that the assumptions on which forward looking statements are based will prove to be correct, or that the Company’s business or operations will not be affected in any material manner by these or other factors not foreseen or foreseeable by the Company or management or beyond the Company’s control.
Although the Company attempts and has attempted to identify factors that would cause actual actions, events or results to differ materially from those disclosed in forward looking statements, there may be other factors that could cause actual results, performance, achievements or events not to be as anticipated, estimated or intended, and many events are beyond the reasonable control of the Company. In addition, the Company’s actual results could differ materially from those anticipated in these forward looking statements as a result of the factors outlined in the “Risk Factors” section of the Company’s continuous disclosure filings available on SEDAR+ or the ASX, including, in the company’s current annual report, half year report or most recent management discussion and analysis.
Accordingly, readers are cautioned not to place undue reliance on forward looking statements. Forward looking statements in these materials speak only at the date of issue. Subject to any continuing obligations under applicable law or any relevant stock exchange listing rules, in providing this information the Company does not undertake any obligation to publicly update or revise any of the forward-looking statements or to advise of any change in events, conditions or circumstances.
Appendix A – Previously Unreported Significant Intersections Depicted in Release
SOUTHERN GOLDFIELDS
All widths are downhole. Coordinates are collar. Grid is MGA 1994 Zone 51 Significant = >5g/m for resources.
|
Lode |
Hole |
Collar |
Collar |
Collar |
Intercept (Downhole) |
From |
Dip |
Azi |
|
Beta Hunt |
||||||||
|
A Zone |
SAZ-009-AE |
6,544,880 |
374,050 |
289 |
6.27m at 0.93g/t Au |
284 |
-67 |
51 |
|
3.35m at 1.21g/t Au |
319 |
|||||||
|
Fletcher |
EFDDSP1-49AE |
6,543,700 |
375,633 |
– 502 |
8m at 0.38g/t Au |
54 |
-30 |
238 |
|
23m at 1.95g/t Au |
708 |
|||||||
|
47m at 1.65g/t Au |
760 |
|||||||
|
4m at 1.32g/t Au |
823 |
|||||||
|
10m at 1.51g/t Au |
928 |
|||||||
|
9m at 1.15g/t Au |
951 |
|||||||
|
6m at 1.05g/t Au |
1,001 |
|||||||
|
5m at 0.53g/t Au |
1,041 |
|||||||
|
18.4m at 0.8g/t Au |
1,049 |
|||||||
|
5.5m at 1.24g/t Au |
1,076 |
|||||||
|
WF440DD-26AE |
6,543,651 |
375,056 |
– 433 |
3.4m at 1.22g/t Au |
165 |
-41 |
245 |
|
|
2.6m at 0.94g/t Au |
176 |
|||||||
|
15m at 4.63g/t Au |
219 |
|||||||
|
9m at 0.73g/t Au |
294 |
|||||||
|
19m at 1.19g/t Au |
339 |
|||||||
|
3m at 3.11g/t Au |
411 |
|||||||
|
3m at 0.89g/t Au |
445 |
|||||||
|
6m at 1.91g/t Au |
484 |
|||||||
|
20m at 0.61g/t Au |
620 |
|||||||
|
3.5m at 0.59g/t Au |
655 |
|||||||
|
6m at 6.89g/t Au |
667 |
|||||||
|
17m at 6.65g/t Au |
676 |
|||||||
|
5m at 0.66g/t Au |
702 |
|||||||
|
WF440DD-27AE |
6,543,651 |
375,056 |
– 433 |
4m at 2.29g/t Au |
138 |
-50 |
225 |
|
|
22.7m at 1.67g/t Au |
154 |
|||||||
|
4m at 2.04g/t Au |
179 |
|||||||
|
12m at 0.46g/t Au |
270 |
|||||||
|
19m at 3.69g/t Au |
335 |
|||||||
|
11m at 0.84g/t Au |
362 |
|||||||
|
5.4m at 1.88g/t Au |
398 |
|||||||
|
9m at 0.39g/t Au |
443 |
|||||||
|
3m at 2.67g/t Au |
488 |
|||||||
|
9m at 0.52g/t Au |
494 |
|||||||
|
4m at 1.92g/t Au |
509 |
|||||||
|
3m at 2.01g/t Au |
559 |
|||||||
|
27m at 1.5g/t Au |
582 |
|||||||
|
45m at 0.75g/t Au |
647 |
|||||||
|
WF440DD-31AE |
6,543,651 |
375,056 |
– 433 |
11m at 0.76g/t Au |
149 |
-60 |
220 |
|
|
7.9m at 0.68g/t Au |
168 |
|||||||
|
28m at 0.73g/t Au |
179 |
|||||||
|
11m at 0.9g/t Au |
248 |
|||||||
|
3m at 1.16g/t Au |
292 |
|||||||
|
3m at 2.16g/t Au |
298 |
|||||||
|
4.5m at 0.55g/t Au |
316 |
|||||||
|
12m at 4.13g/t Au |
459 |
|||||||
|
37m at 4.28g/t Au |
477 |
|||||||
|
7m at 1.93g/t Au |
544 |
|||||||
|
10m at 2.54g/t Au |
609 |
|||||||
|
8m at 0.93g/t Au |
704 |
|||||||
|
15m at 2.06g/t Au |
717 |
|||||||
|
2m at 1.24g/t Au |
784 |
|||||||
|
WF440N1-05AE |
6,543,787 |
375,045 |
– 437 |
7m at 2.68g/t Au |
– |
-27 |
263 |
|
|
8m at 0.46g/t Au |
10 |
|||||||
|
16.7m at 0.31g/t Au |
75 |
|||||||
|
14.2m at 1.16g/t Au |
117 |
|||||||
|
6m at 0.46g/t Au |
413 |
|||||||
|
4m at 2.74g/t Au |
461 |
|||||||
|
38m at 0.73g/t Au |
476 |
|||||||
|
6.6m at 41.84g/t Au |
516 |
|||||||
|
9m at 0.22g/t Au |
528 |
|||||||
|
7m at 0.92g/t Au |
550 |
|||||||
|
9m at 0.68g/t Au |
575 |
|||||||
|
17m at 1.2g/t Au |
602 |
|||||||
|
3m at 1.77g/t Au |
636 |
|||||||
|
3m at 3.7g/t Au |
654 |
|||||||
|
4m at 1.01g/t Au |
729 |
|||||||
|
3m at 0.87g/t Au |
796 |
|||||||
|
5m at 0.99g/t Au |
822 |
|||||||
|
8m at 3.16g/t Au |
862 |
|||||||
|
2.9m at 1.62g/t Au |
872 |
|||||||
|
WF440VD-53AE |
6,543,694 |
374,992 |
– 437 |
8.5m at 2.12g/t Au |
188 |
-10 |
249 |
|
|
WF440VD-54AE |
6,543,694 |
374,992 |
– 437 |
31m at 5.63g/t Au |
228 |
-10 |
265 |
|
|
7m at 0.83g/t Au |
266 |
|||||||
|
4m at 6.15g/t Au |
279 |
|||||||
|
36m at 1.5g/t Au |
293 |
|||||||
|
6m at 0.76g/t Au |
332 |
|||||||
|
WF440VD-55AE |
6,543,694 |
374,992 |
– 437 |
5m at 0.47g/t Au |
119 |
-10 |
278 |
|
|
3m at 1.06g/t Au |
236 |
|||||||
|
24.6m at 6.9g/t Au |
274 |
|||||||
|
WF490DD-42AE |
6,543,672 |
374,950 |
– 484 |
17m at 2.05g/t Au |
206 |
-34 |
247 |
|
|
15m at 3.51g/t Au |
307 |
|||||||
|
WF490DD-46AE |
6,543,672 |
374,950 |
– 484 |
7m at 3.35g/t Au |
152 |
-49 |
251 |
|
|
6m at 0.83g/t Au |
162 |
|||||||
|
12m at 0.33g/t Au |
227 |
|||||||
|
27.64m at 0.92g/t Au |
306 |
|||||||
|
7.05m at 4.8g/t Au |
354 |
|||||||
|
11m at 1.65g/t Au |
369 |
|||||||
|
6m at 0.67g/t Au |
452 |
|||||||
|
4m at 0.59g/t Au |
491 |
|||||||
|
4m at 2.01g/t Au |
500 |
|||||||
|
3m at 0.67g/t Au |
523 |
|||||||
|
11m at 2.41g/t Au |
561 |
|||||||
|
14m at 2.34g/t Au |
588 |
|||||||
|
3m at 2.01g/t Au |
611 |
|||||||
|
WF440DD-09AR |
6,543,667 |
375,051 |
– 433 |
NSI |
– |
-14 |
234 |
|
|
Larkin |
LL-1730-06AG |
6,543,249 |
375,312 |
– 300 |
6m at 1.16g/t Au |
87 |
-23 |
276 |
|
LL320-01AG |
6,543,169 |
375,323 |
– 305 |
5m at 1.27g/t Au |
54 |
51 |
246 |
|
|
2.55m at 2.75g/t Au |
70 |
|||||||
|
LL320-02AG |
6,543,169 |
375,323 |
– 305 |
NSI |
– |
|||
|
LL320-04AG |
6,543,172 |
375,317 |
– 310 |
13m at 1.8g/t Au |
44 |
-21 |
240 |
|
|
LL320-05AG |
6,543,172 |
375,317 |
– 310 |
11m at 1.94g/t Au |
59 |
-39 |
246 |
|
|
LL320-06AG |
6,543,172 |
375,317 |
– 311 |
3.08m at 5.56g/t Au |
69 |
-50 |
251 |
|
|
4m at 1.39g/t Au |
82 |
|||||||
|
LL320-07AG |
6,543,172 |
375,317 |
– 311 |
2m at 6.72g/t Au |
52 |
-62 |
240 |
|
|
18.5m at 6.76g/t Au |
119 |
|||||||
|
LL320-08AG |
6,543,147 |
375,332 |
– 309 |
3.1m at 2.93g/t Au |
62 |
54 |
239 |
|
|
LL320-09AG |
6,543,147 |
375,332 |
– 309 |
2m at 6g/t Au |
54 |
42 |
237 |
|
|
LL320-10AG |
6,543,147 |
375,332 |
– 309 |
5m at 2.83g/t Au |
47 |
2 |
238 |
|
|
LL320-11AG |
6,543,147 |
375,332 |
– 309 |
13m at 3.51g/t Au |
54 |
-38 |
238 |
|
|
LL320-12AG |
6,543,146 |
375,334 |
– 308 |
NSI |
– |
|||
|
LL320-13AG |
6,543,146 |
375,335 |
– 313 |
5.4m at 1.3g/t Au |
45 |
39 |
208 |
|
|
9m at 2.37g/t Au |
55 |
|||||||
|
LL320-14AG |
6,543,146 |
375,335 |
– 313 |
9m at 1.67g/t Au |
51 |
4 |
208 |
|
|
LL320-15AG |
6,543,146 |
375,334 |
– 312 |
16m at 2.35g/t Au |
55 |
-30 |
210 |
|
|
LL320-16AG |
6,543,146 |
375,334 |
– 312 |
12m at 1.48g/t Au |
65 |
-42 |
209 |
|
|
7m at 1.63g/t Au |
110 |
|||||||
|
3m at 2.93g/t Au |
138 |
|||||||
|
19m at 1.74g/t Au |
201 |
|||||||
|
LL320-17AG |
6,543,146 |
375,334 |
– 312 |
6m at 6.79g/t Au |
85 |
-50 |
211 |
|
|
7m at 1.63g/t Au |
213 |
|||||||
|
2m at 2.72g/t Au |
230 |
|||||||
|
6m at 0.99g/t Au |
266 |
|||||||
|
10m at 0.91g/t Au |
276 |
|||||||
|
LL320-18AG |
6,543,169 |
375,323 |
– 305 |
5.4m at 2.65g/t Au |
52 |
27 |
246 |
|
|
LL320-19AG |
6,543,147 |
375,332 |
– 309 |
3.4m at 2.28g/t Au |
48 |
30 |
234 |
|
|
LL395INC-02AR |
6,543,036 |
375,390 |
– 377 |
NSI |
– |
|||
|
LL395INC-03AR |
6,543,037 |
375,391 |
– 378 |
3m at 2.64g/t Au |
53 |
30 |
260 |
|
|
LL395INC-06AR |
6,543,036 |
375,390 |
– 380 |
4m at 3.43g/t Au |
52 |
-8 |
274 |
|
|
LL395INC-07AR |
6,543,037 |
375,390 |
– 380 |
2m at 2.99g/t Au |
59 |
-6 |
296 |
|
|
8m at 1.37g/t Au |
73 |
|||||||
|
2m at 30.6g/t Au |
105 |
|||||||
|
3m at 3.72g/t Au |
149 |
|||||||
|
LL395INC-10AR |
6,543,037 |
375,389 |
– 381 |
10.6m at 3.85g/t Au |
99 |
-33 |
289 |
|
|
LL395INC-11AR |
6,543,037 |
375,389 |
– 381 |
2m at 4.24g/t Au |
53 |
-48 |
289 |
|
|
4m at 2.2g/t Au |
150 |
|||||||
|
14.85m at 3.61g/t Au |
165 |
|||||||
|
6.95m at 3.96g/t Au |
182 |
|||||||
|
LL395INC-28AR |
6,543,036 |
375,390 |
– 376 |
NSI |
– |
|||
|
Lake Cowan |
||||||||
|
KHKRC0001 |
6,495,497 |
394,479 |
269 |
NSI |
-90 |
351 |
||
|
KHKRC0002 |
6,495,495 |
394,484 |
269 |
NSI |
-90 |
31 |
||
|
KHKRC0003 |
6,495,489 |
394,475 |
269 |
NSI |
-89 |
344 |
||
|
KHKRC0004 |
6,495,486 |
394,489 |
269 |
NSI |
-90 |
255 |
||
|
KHKRC0005 |
6,495,481 |
394,481 |
269 |
NSI |
-90 |
66 |
||
|
KHKRC0006 |
6,495,533 |
394,563 |
269 |
NSI |
-90 |
38 |
||
|
KHKRC0007 |
6,495,518 |
394,551 |
269 |
2m at 3.15g/t Au |
10 |
-90 |
– |
|
|
KHKRC0008 |
6,495,512 |
394,543 |
269 |
NSI |
-89 |
342 |
||
|
KHKRC0009 |
6,495,506 |
394,535 |
269 |
NSI |
-89 |
277 |
||
|
KHKRC0010 |
6,495,501 |
394,527 |
269 |
4m at 5.84g/t Au |
18 |
-90 |
– |
|
|
KHKRC0011 |
6,495,495 |
394,519 |
269 |
4m at 1.42g/t Au |
24 |
-90 |
– |
|
|
KHKRC0012 |
6,495,489 |
394,510 |
269 |
NSI |
-89 |
249 |
||
|
KHKRC0013 |
6,495,483 |
394,502 |
269 |
NSI |
-89 |
71 |
||
|
KHKRC0015 |
6,495,472 |
394,486 |
269 |
7m at 1.26g/t Au |
27 |
-90 |
– |
|
|
KHKRC0016 |
6,495,466 |
394,478 |
269 |
4m at 1.59g/t Au |
27 |
-90 |
– |
|
|
KHKRC0017 |
6,495,461 |
394,470 |
269 |
NSI |
-89 |
32 |
||
|
KHKRC0018 |
6,495,510 |
394,557 |
269 |
NSI |
-89 |
358 |
||
|
KHKRC0019 |
6,495,501 |
394,545 |
269 |
NSI |
-90 |
156 |
||
|
KHKRC0020 |
6,495,495 |
394,537 |
269 |
NSI |
-89 |
27 |
||
|
KHKRC0021 |
6,495,489 |
394,528 |
269 |
NSI |
-90 |
279 |
||
|
KHKRC0022 |
6,495,474 |
394,507 |
269 |
NSI |
-89 |
331 |
||
|
KHKRC0023 |
6,495,468 |
394,499 |
269 |
2 m at 3.05g/t Au |
-90 |
55 |
||
|
KHKRC0024 |
6,495,462 |
394,490 |
269 |
3m at 2.98g/t Au |
28 |
-90 |
– |
|
|
KHKRC0025 |
6,495,457 |
394,482 |
269 |
5m at 1.67g/t Au |
36 |
-90 |
– |
|
|
KHKRC0026 |
6,495,530 |
394,595 |
270 |
3m at 5.73g/t Au |
16 |
-90 |
– |
|
|
KHKRC0027 |
6,495,525 |
394,587 |
269 |
NSI |
-90 |
128 |
||
|
KHKRC0028 |
6,495,519 |
394,579 |
269 |
NSI |
-90 |
156 |
||
|
KHKRC0029 |
6,495,484 |
394,538 |
269 |
2m at 4.65g/t Au |
10 |
-90 |
– |
|
|
KHKRC0030 |
6,495,479 |
394,530 |
269 |
4m at 5.14g/t Au |
19 |
-90 |
– |
|
|
KHKRC0031 |
6,495,473 |
394,522 |
268 |
NSI |
-89 |
203 |
||
|
KHKRC0032 |
6,495,452 |
394,492 |
269 |
9m at 1.01g/t Au |
26 |
-90 |
– |
|
|
KHKRC0033 |
6,495,447 |
394,485 |
269 |
NSI |
-89 |
263 |
||
|
KHKRC0034 |
6,495,548 |
394,638 |
270 |
NSI |
-90 |
179 |
||
|
KHKRC0035 |
6,495,535 |
394,618 |
270 |
2m at 3.8g/t Au |
13 |
-90 |
– |
|
|
KHKRC0036 |
6,495,470 |
394,535 |
268 |
NSI |
-89 |
293 |
||
|
KHKRC0037 |
6,495,464 |
394,526 |
268 |
NSI |
-89 |
314 |
||
|
KHKRC0038 |
6,495,452 |
394,510 |
268 |
3m at 3.13g/t Au |
23 |
-90 |
– |
|
|
KHKRC0039 |
6,495,446 |
394,502 |
269 |
5m at 2.3 |
27 |
-89 |
250 |
|
|
KHKRC0040 |
6,495,520 |
394,615 |
270 |
NSI |
-90 |
193 |
||
|
KHKRC0041 |
6,495,508 |
394,598 |
270 |
3m at 1.92g/t Au |
||||

