Imagine an investment strategy that’s not based on financial metrics or economic data, but instead on the calendar—specifically, around Halloween. This idea, known as the “Halloween Effect”, suggests that stock market performance improves dramatically after October 31st, with the strongest returns seen between November and April.
Legend has it that the Halloween Effect originated in the City of London in the late 16th century and has been passed from trader to trader ever since. During that time, wealthy traders and investors would often take extended breaks in the summer, leaving the markets quieter and less active; however, when they returned to the markets in the fall, trading volumes increased, leading to a stronger performance from November onward.
Fast forward to today and the pattern still holds.
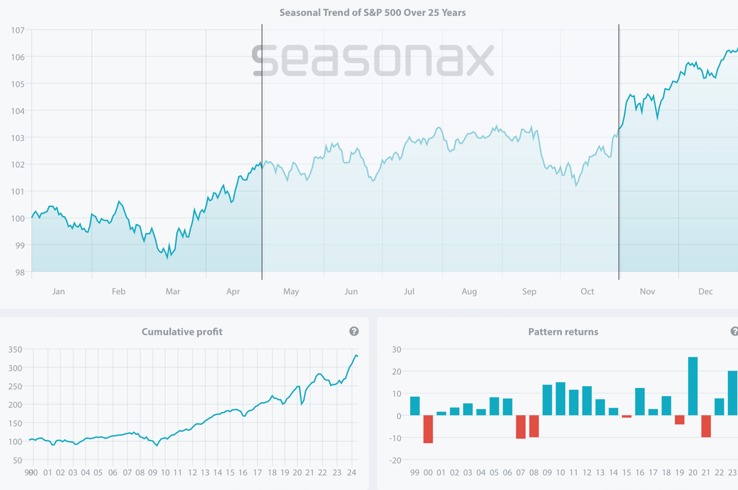
A look at the S&P 500 Index over the past 25 years reveals a consistent seasonal tendency from October 31 to April 30. Since 1999, 76% of trades during this period have been profitable, with an average return of over 4.8%, proving that the Halloween Effect remains a reliable seasonal trend for investors.
Seasonal pattern of S&P 500 over the past 25 years

Source: Seasonax, sign up here https://app.seasonax.com/signup to access further analysis, 30 days for free
Keep in mind that the seasonal chart shows the average price pattern of the stock calculated over recent years. The horizontal axis shows the time of the year, and the vertical axis shows the percentage changes in the value of the stock, or in our case indices (indexed to 100).
What Fuels the Halloween Effect?
The retail sector, with the upcoming holiday shopping season, is one of the drivers of the surge in stocks in coming months. Halloween is just one of the sales events that unleash additional spending. Next is Black Friday, which is also set to contribute to driving stock prices up, followed by investor sentiment during the festive season and the traditional year-end stock rally.
Besides short upcoming trends in the stocks of some popular candy retailers, costume sellers and movies (see Netflix) around Halloween, there is also a long lasting trend making its way in the coming weeks.
I have focused therefore on identifying promising trade opportunities during the initial weeks of the Halloween Effect, from the end of October to the last trading days of December, using the Seasonax Screener.
Trick or Treat on the Stock Exchange?
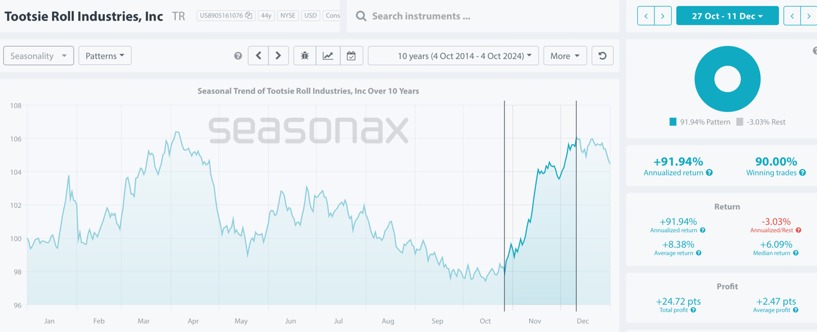
One standout performer is Tootsie Roll Industries, an American candy manufacturer that thrives around the holiday season. Over the past 10 years, Tootsie Roll has experienced a strong seasonal trend from October 27 to December 11, with an average gain of 8.38% in just 32 trading days. The returns have been consistently positive since 2014, with only one outlier year in 2015.
Seasonal chart of Tootsie Roll Industries over the past 10 years

Source: Seasonax, sign up here https://app.seasonax.com/signup to access further analysis, 30 days for free
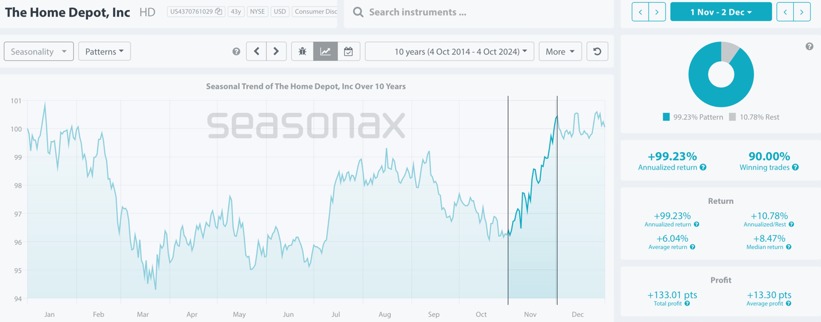
Another strong company to keep an eye on is Home Depot. With an estimated 82% of Americans decorating their homes for Halloween, Home Depot has become a top destination for seasonal decor and supplies. From November 1 to December 2 over the past decade, the stock has shown a consistent upward trend, delivering an average return of over 6% and achieving 90% winning trades during this period.
*Detrended seasonal chart of The Home Depot over the past 10 years

*Learn more about detrended seasonal charts: https://www.youtube.com/watch?v=I7YaQLJmyhE
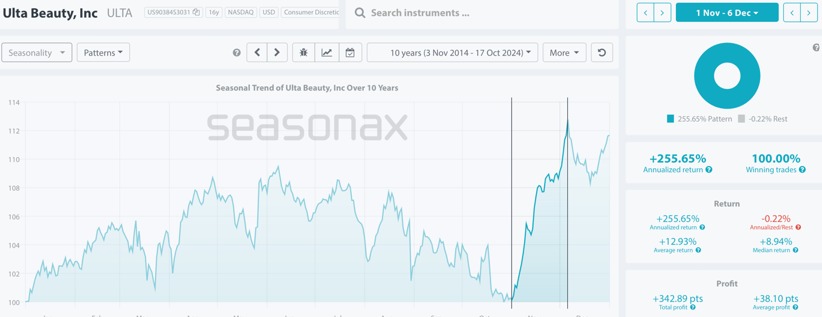
Likewise, Ulta Beauty is a hot stock to watch during the holiday season. In just 25 trading days from November 1 to December 6 over the last 10 years, Ulta has delivered an impressive average return of nearly 13%, with positive returns every year since 2015. As consumers rush to buy gifts and take advantage of holiday promotions, beauty shopping pushes Ulta’s stock to new heights.
Seasonal chart of Ulta Beauty over the past 10 years

Source: Seasonax, sign up here https://app.seasonax.com/signup to access further analysis, 30 days for free
Two more stocks that tend to shine during the Halloween season are Costco and Hasbro.
Costco benefits from bulk purchases as consumers stock up on candy, decorations, and party supplies, driving steady stock growth in the weeks around Halloween.
Similarly, Hasbro sees a boost in sales for costume-related toys and licensed merchandise, with popular superhero outfits and themed toys fueling its stock performance during the spooky season.
Should You Follow the Halloween Effect?
While no one can predict whether the Halloween Effect will persist in 2024, seasonality offers a statistically verifiable strategy that highlights the probability of certain price moves. As a trading strategy, it is one of just a few approaches that are statistically verifiable.
Since the calendar-based drivers underlying seasonal trends are independent of other driving factors, seasonality consistently creates added value for investors from a statistical perspective. In other words, you can incorporate seasonality and this use of statistical probability and pattern recurrence into the trading approaches you have employed so far. Maybe Halloween can be more treat than trick!
Analyze more than 25.000+ instruments including stocks, (crypto)currencies, commodities, indexes to learn more go to https://app.seasonax.com/
—
Originally Posted October 29, 2024 – Halloween Stocks to Watch
Disclosure: Seasonax
Past results and past seasonal patterns are no indication of future performance, in particular, future market trends. Seasonax GmbH neither recommends nor approves of any particular financial instrument, group of securities, segment of industry, analysis interval or any particular idea, approach, strategy or attitude nor provides consulting nor brokerage nor asset management services. Seasonax GmbH hereby excludes any explicit or implied trading recommendation, in particular, any promise, implication or guarantee that profits are earned and losses excluded, provided, however, that in case of doubt, these terms shall be interpreted in abroad sense. Any information provided by Seasonax GmbH or on this website or any other kind of data media shall not be construed as any kind of guarantee, warranty or representation, in particular as set forth in a prospectus. Any user is solely responsible for the results or the trading strategy that is created, developed or applied. Indicators, trading strategies and functions provided by seasonax GmbH or on this website or any other kind of data media may contain logical or other errors leading to unexpected results, faulty trading signals and/or substantial losses. Seasonax GmbH neither warrants nor guarantees the accuracy, completeness, quality, adequacy or content of the information provided by it or on this website or any other kind of data media. Any user is obligated to comply with any applicable capital market rules of the applicable jurisdiction. All published content and images on this website or any other kind of data media are protected by copyright. Any duplication, processing, distribution or any form of utilisation beyond the scope of copyright law shall require the prior written consent of the author or authors in question. Futures and forex trading contains substantial risk and is not for every investor. An investor could potentially lose all or more than the initial investment. Risk capital is money that can be lost without jeopardizing ones’ financial security or lifestyle. Only risk capital should be used for trading and only those with sufficient risk capital should consider trading. Past performance is not necessarily indicative of future results. Testimonials appearing on this website may not be representative of other clients or customers and is not a guarantee of future performance or success.
Disclosure: Interactive Brokers
Information posted on IBKR Campus that is provided by third-parties does NOT constitute a recommendation that you should contract for the services of that third party. Third-party participants who contribute to IBKR Campus are independent of Interactive Brokers and Interactive Brokers does not make any representations or warranties concerning the services offered, their past or future performance, or the accuracy of the information provided by the third party. Past performance is no guarantee of future results.
This material is from Seasonax and is being posted with its permission. The views expressed in this material are solely those of the author and/or Seasonax and Interactive Brokers is not endorsing or recommending any investment or trading discussed in the material. This material is not and should not be construed as an offer to buy or sell any security. It should not be construed as research or investment advice or a recommendation to buy, sell or hold any security or commodity. This material does not and is not intended to take into account the particular financial conditions, investment objectives or requirements of individual customers. Before acting on this material, you should consider whether it is suitable for your particular circumstances and, as necessary, seek professional advice.

