So much for that soft inflation optimism…
A few days ago, as we looked ahead to this ‘Inflation Week,’ we noted that:
“According to real-time estimates from the Cleveland Fed, this week’s Consumer Price Index (CPI) data is expected to show a 4-basis-point decline in January’s headline inflation rate and an 11-basis-point decline in the core rate. It should be the first report since July 2024 that includes a decline in both the headline and core CPI inflation rates.”
But today’s data certainly painted a different picture.
The latest CPI report showed that inflation ran much hotter than expected last month, dashing hopes for more Fed rate cuts to support the U.S. economy (and the stock market). And that sour news has sent stocks spinning lower.
However, upon closer inspection, January’s hot CPI report wasn’t as bad as the headline numbers suggest.
That’s why we think today’s inflation-driven stock selloff is a buying opportunity.
Our Takeaway From Today’s Hot Inflation Data
Now, admittedly, the headline numbers in January’s inflation report were awful.
Consumer prices rose 0.5% month-over-month, much hotter than the 0.3% rise expected by economists. Core consumer prices – excluding volatile food and energy prices – rose 0.4%, also higher than the anticipated 0.3% increase.
On a year-over-year basis, the consumer price inflation rate jumped from 2.9% in December to 3.0% in January. Core consumer price inflation rose from 3.1% to 3.3%.
It was the first month since October 2024 that both the headline and core consumer price inflation rates rose at the same time.
In other words, it was a very ugly report.
But we think this ugliness is temporary.
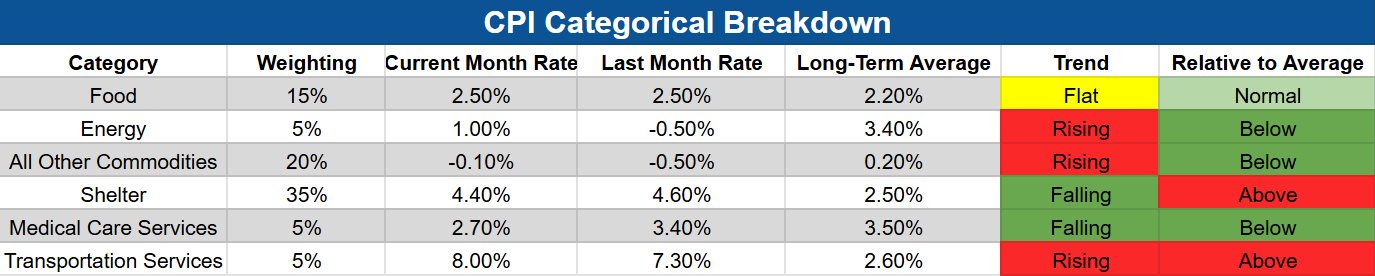
A closer look at the CPI report’s major categories shows that conditions look favorable. Shelter, the largest contributor – which accounts for about 35% of the consumer price index – continues to drop. The second-biggest category – all commodities excluding food and shelter, which accounts for about 20% of the index – is running negative. Food – an important category with a 15% weighting – is running flat and in-line with its long-term averages.
Across the board, inflation trends still look fine to us. Most major categories either have a positive trend (falling inflation) or are low on an absolute basis (running below their long-term average levels).
The only major category that is experiencing rising inflation at an “above-normal” level is Transportation Services. That may well have been negatively impacted by the wildfires that raged in California last month – so we don’t think it will last.
It is also worth noting that oil prices – a major input to inflation – have been much lower so far in February than they were in January.
Last month, oil prices averaged more than $75 per barrel. Yet throughout the first half of February, oil prices have averaged just about $72 per barrel, while other commodity prices have generally fallen, too.
For these reasons, we think today’s hot inflation report was a one-off…
Which makes today’s stock selloff particularly compelling.
The Final Word
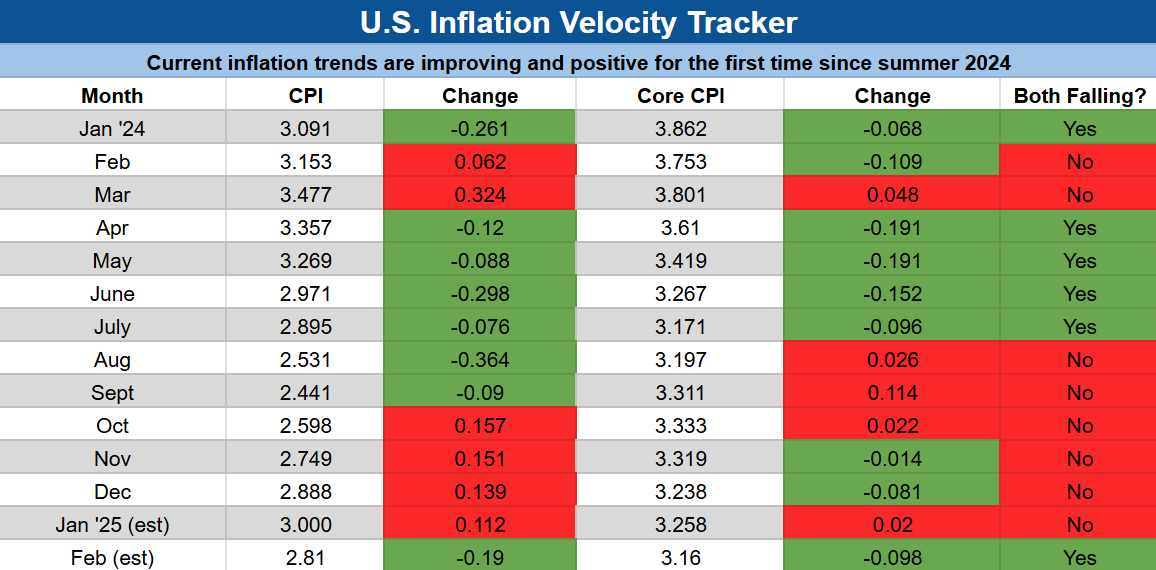
In fact, inflation trends are already turning positive in February.
According to real-time estimates from the Cleveland Fed, February’s CPI is running at 2.8% (down from the 3% rate reported in January). And its core CPI rate is running at 3.16% (down from January’s 3.26%).
In other words, real-time estimates suggest that both headline and core inflation rates are falling in February for the first time since July 2024.
As such, it seems today’s inflation-driven market selloff is overblown.
We would be buyers on this dip.
And we think the best place to look for the best dip-buying opportunities is in the world of autonomous vehicles…
Because this could truly be the year that self-driving cars go mainstream.
Think about it. Autonomous vehicle company Waymo is already operating driverless robotaxi services in San Francisco, Los Angeles, and Phoenix, fulfilling about 150,000 rides per week. And it has plans to expand to 10 new cities in 2025, including Las Vegas, San Diego, Atlanta, Austin, and Miami.
Meanwhile, Tesla is targeting to launch its own robotaxi service in Austin this June, and Lyft has said it intends to do the same in Dallas in 2026.
The Age of Autonomous Vehicles has arrived – and so have huge opportunities in AV stocks.
Learn more about how to get in front of this megatrend as it expands during Trump 2.0.
On the date of publication, Luke Lango did not have (either directly or indirectly) any positions in the securities mentioned in this article.
P.S. You can stay up to speed with Luke’s latest market analysis by reading our Daily Notes! Check out the latest issue on your Innovation Investor or Early Stage Investor subscriber site.
