For some time, we have noted that momentum trades have ruled the equity market. Buying dips, chasing rallies, and leverage have been popular themes, and quite frankly, that trifecta has generally worked beautifully – particularly last week, when the S&P 500 rose over 4% on post-election euphoria. But a select group of investments has taken momentum to another level. Parabolic moves are one thing; vertical ones, like we see in Tesla (TSLA) or bitcoin are another.
Just one week ago, TSLA closed at $242.84. As I type this, it is trading just under $350. That is over 40% IN A WEEK! Other than a takeover or maybe a biotech stock getting FDA approval, I can’t come up with a precedent for a stock moving so quickly – especially one that started with a multi-billion-dollar valuation before its move. In a conversation earlier today, someone asked me about the recent parabolic move, and I jokingly corrected him. It’s vertical, not parabolic.
TSLA 3-months, Daily Candles

Source: Interactive Brokers
And the move makes sense, at least to a point. Elon Musk went “all-in” on a Trump victory, spending hundreds of millions of dollars and countless hours on the effort, so it is understandable why the market would view TSLA as a beneficiary. During their business careers, both men have shown a propensity toward transactional thinking, thus expectations for a quid pro quo might be in order. A favorable regulatory environment, whether in a general sense or specifically tailored to Musk’s ventures, could certainly smooth the way for a robotaxi or an expansion of FSD. Although the President-elect has previously expressed hostility towards electric vehicles, the market is certainly thinking that the hostility will either be tempered by Elon Musk’s persuasion or applied in a manner that benefits TSLA over its competitors.
TSLA has recently soared to once again become the most active stock and options class among IBKR customers, surpassing recent favorite NVDA. Over the past week prior to today, TSLA’s options activity has been more than double that of NVDA’s, though it is important to note that the net stock and options activity over that period was quite well balanced. After the recent move, I admit to being surprised by that finding. Because my visibility into customer activity is extremely limited – I can only see cumulative five-day average order flow for our top 25 names — I can’t discern whether TSLA has been favored by disciplined day traders or those trading around long (or even short) positions. Someone has been accumulating the stock and call options, but it is not necessarily our customers.
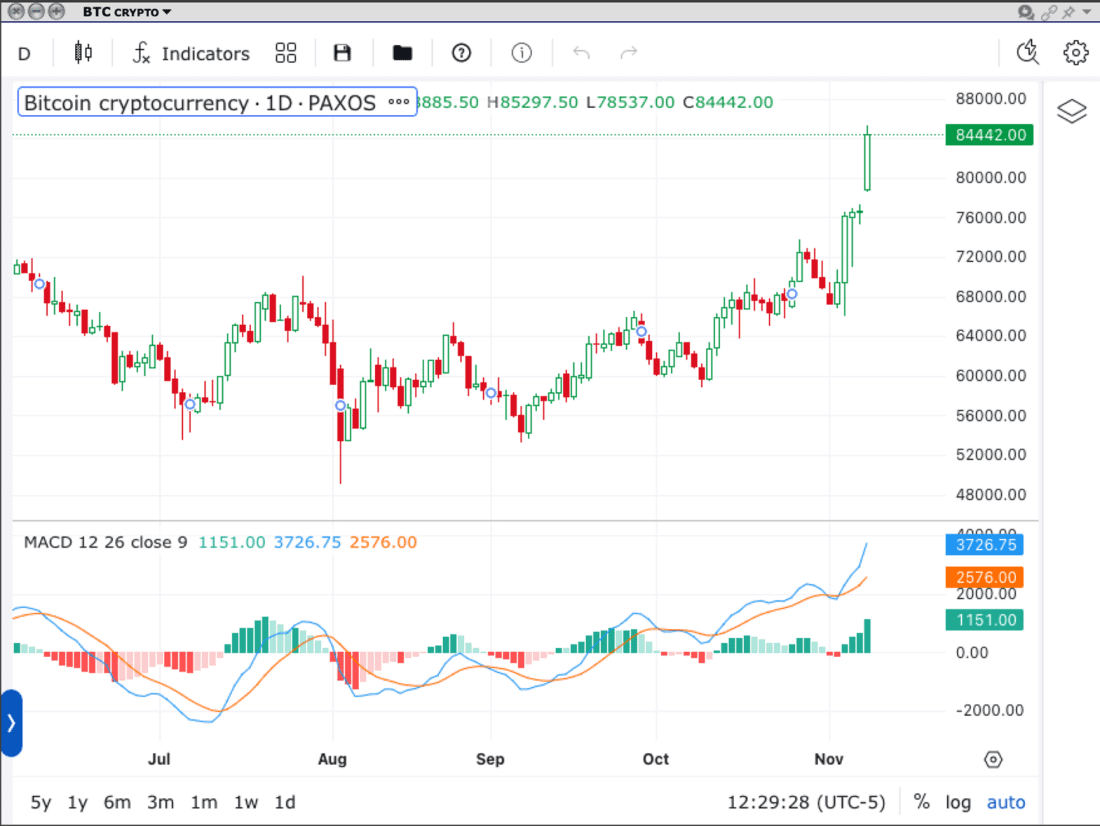
Bitcoin has certainly had a fabulous run of its own, though its 25% weekly move pales somewhat compared to TSLA’s. We saw the Presidential campaign cozy up to crypto enthusiasts, so they too expect that the incoming administration will be far friendlier to their interests. That said, the 3-month chart bitcoin has a much more pronounced bottoming pattern. It didn’t actually decline much from its prior highs, but the rounding bottom seems quite obvious in the period leading up to the election:
Bitcoin 3-months, Daily Candles

Source: Interactive Brokers
If there is a fly in the ointment for the post-election rally, it is that breadth has been rather pedestrian for a broad move of this magnitude. Advances have beaten decliners by roughly a 3:2 average over the past few days. One should expect a far more robust ratio for a sustained move of that size – certainly something much greater than 2:1. We simply haven’t seen that. And even not all Trump-trades are performing as well as hoped. As I write this, Trump Media & Technology is actually down slightly over the past week, though it remains the third-most active stock on our platform.
Considering that the current moves in TSLA and bitcoin are indeed more accurately described as parabolic, it is important to remember that parabolic moves have a way of unwinding unpredictably. If too many people get sucked into a vertical rally, the move can have a tendency to exhaust its fuel. Or in this case, zoom so fast that its batteries need to be recharged at an inopportune team. Even the best cars can’t maintain ludicrous mode indefinitely.
Disclosure: Interactive Brokers
The analysis in this material is provided for information only and is not and should not be construed as an offer to sell or the solicitation of an offer to buy any security. To the extent that this material discusses general market activity, industry or sector trends or other broad-based economic or political conditions, it should not be construed as research or investment advice. To the extent that it includes references to specific securities, commodities, currencies, or other instruments, those references do not constitute a recommendation by IBKR to buy, sell or hold such investments. This material does not and is not intended to take into account the particular financial conditions, investment objectives or requirements of individual customers. Before acting on this material, you should consider whether it is suitable for your particular circumstances and, as necessary, seek professional advice.
The views and opinions expressed herein are those of the author and do not necessarily reflect the views of Interactive Brokers, its affiliates, or its employees.
Disclosure: Options Trading
Options involve risk and are not suitable for all investors. Multiple leg strategies, including spreads, will incur multiple commission charges. For more information read the “Characteristics and Risks of Standardized Options” also known as the options disclosure document (ODD) or visit ibkr.com/occ

