Last week the Congressional Budget Office (CBO) released their latest ten year budget projection. It invariably makes for depressing, if unsurprising reading. Significant deterioration in our fiscal outlook is visible with every release.
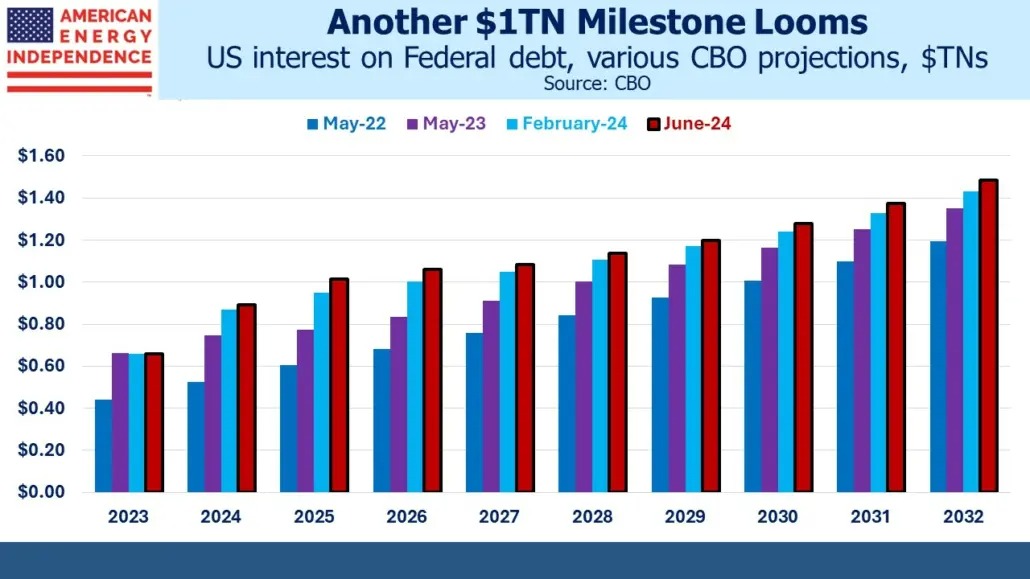
For example, in February we noted that one particular milestone, the year in which interest on the Federal debt exceeds $1TN, keeps moving closer (see Our Darkening Fiscal Outlook).
In 2022, this was forecast for 2030. A year later the date had drawn two years closer, to 2028. In February it was projected to happen in 2026. And in the CBO’s latest release they now expect Federal interest expense to exceed $1TN next year.

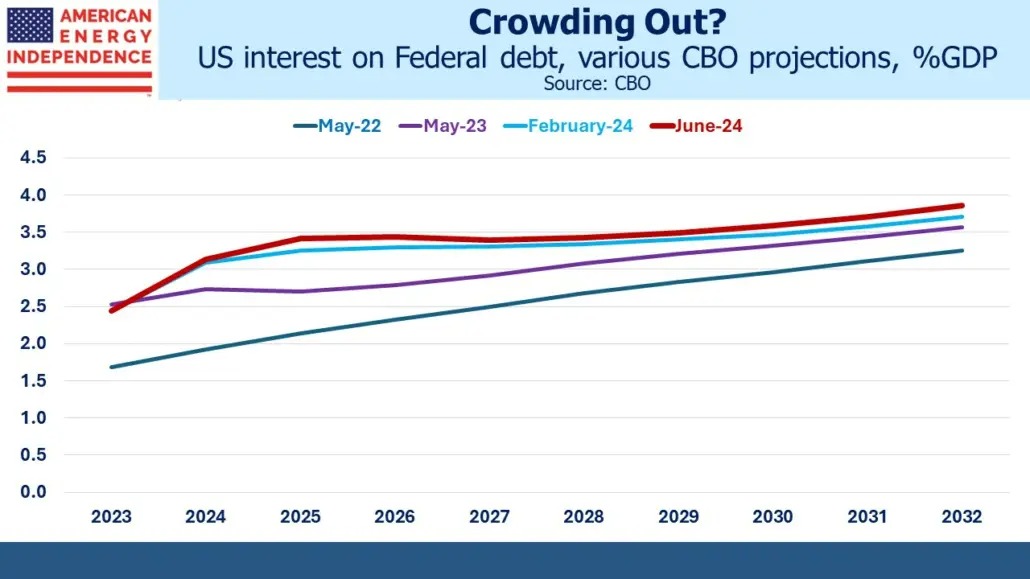
It seems our fiscal outlook is not just getting worse – it’s deteriorating at an increasing pace. Two years ago, 2025 Federal revenues (mostly taxes) were projected to be 17.6% of GDP. Now it’s 17.0%. 2025 spending has gone from 22.3% to 23.5%. Mandatory, discretionary and net interest have all increased – the latter from 2.1% to 3.4% of GDP.
The pandemic-related inflation surge was hugely damaging. It’s consistently among the top concerns of voters, which augurs poorly for Joe Biden’s re-election hopes. It’s made worse because traditional inflation gauges don’t correspond with how consumers experience higher prices. Hedonic quality adjustments, owners’ equivalent rent and even insurance (see Another Inflation Omission) are all subjected to statistical purity which renders them less comprehensible to non-economists. Higher inflation has exacerbated the metric’s impenetrability for many.

On top of that, Democrat policies have been inflationary, starting with the $1.9TN stimulus package signed within a few months of Biden’s inauguration. The energy transition is also inflationary – it’s increasing electricity prices and pumping hundreds of billions of dollars into the economy through tax breaks and subsidies.
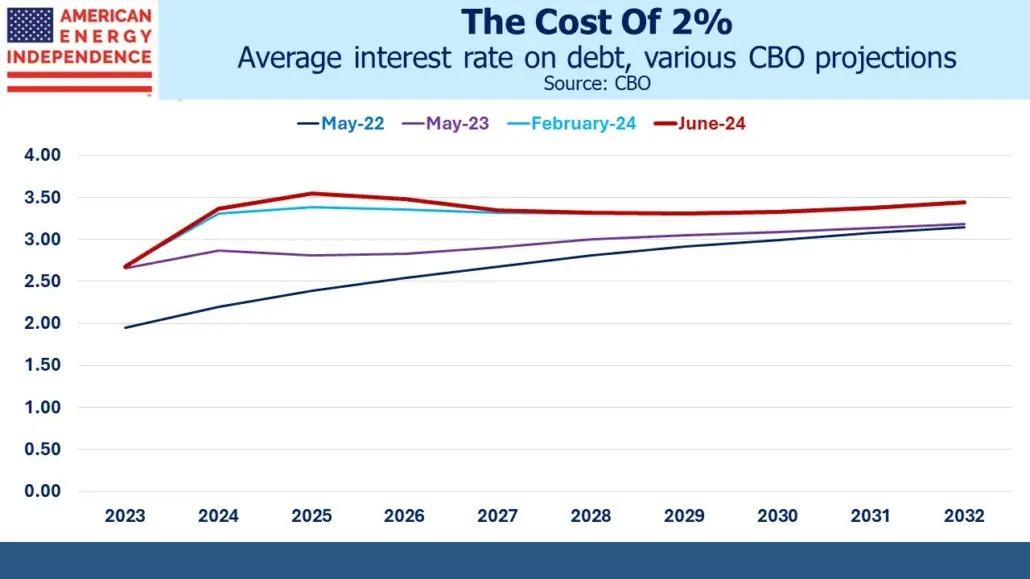
The resulting tighter monetary policy has been costly. Two years ago, the CBO was projecting the average rate on public debt in 2025 at 2.39%. Now they expect it to be 3.55%. Monetary policy caused the recent fiscal deterioration and is driving our debt higher.

Fed chair Powell has argued that our economic future can only be assured by returning inflation to 2%. A less robust monetary response would have reduced the damage to our debt outlook, but orthodoxy holds that we would ultimately have been worse off.
There are no votes in fiscal prudence. Bill Clinton was the last president to make a serious attempt at reducing the deficit. Our current path is democratic if ill-advised. It demonstrates that democracies are ill-suited to tackle long term problems whose benefits accrue to later generations while the costs are incurred today.
Climate change shares this generational misalignment of interests. The warnings of climate catastrophe are persistent, yet coal consumption continues higher as poorer countries value higher living standards today over a cooler future.
Fiscal catastrophe gets no coverage – on this issue the warnings have worn themselves out. Because we’ve continued to muddle through there’s no urgency to address the issue.
The long term investor has to ponder how this will resolve itself. An onslaught of selling by foreign central banks abandoning hope of fiscal reform was once felt to be a threat. Japan owns $1.1TN and China just under $800BN. They couldn’t sell that much if they tried, and in any case the Fed’s $7.3BN balance sheet could absorb it. If bond yields spiked, the Fed would step in to assure an orderly market. Quantitative Easing has emasculated the bond vigilantes.
Currency debasement has been the refuge of profligate governments for centuries, as I explained over a decade ago in Bonds Are Not Forever; The Crisis Facing Fixed Income Investors. Higher inflation allows for negative real interest rates on debt, a stealth default that is less painful than a sudden one.

The CBO expects the cost of financing our debt to average around 3.4%, 1.4% above the Fed’s inflation target. A 3-4% inflation target would lower the real cost by making it easier for short term rates to be below inflation, if only the Fed would accept it. The support among monetary thinkers for such flexibility is growing. Jay Powell has already modified the FOMC’s interpretation of its dual mandate to allow for temporary inflation overshoots in the interests of maximizing employment. Because this is an asymmetric shift, it means higher than 2% inflation over a cycle.
The voter dissatisfaction with higher inflation is supportive of the Fed’s monetary response but makes it tricky to accommodate the negative real interest rates that will ameliorate our debt outlook.
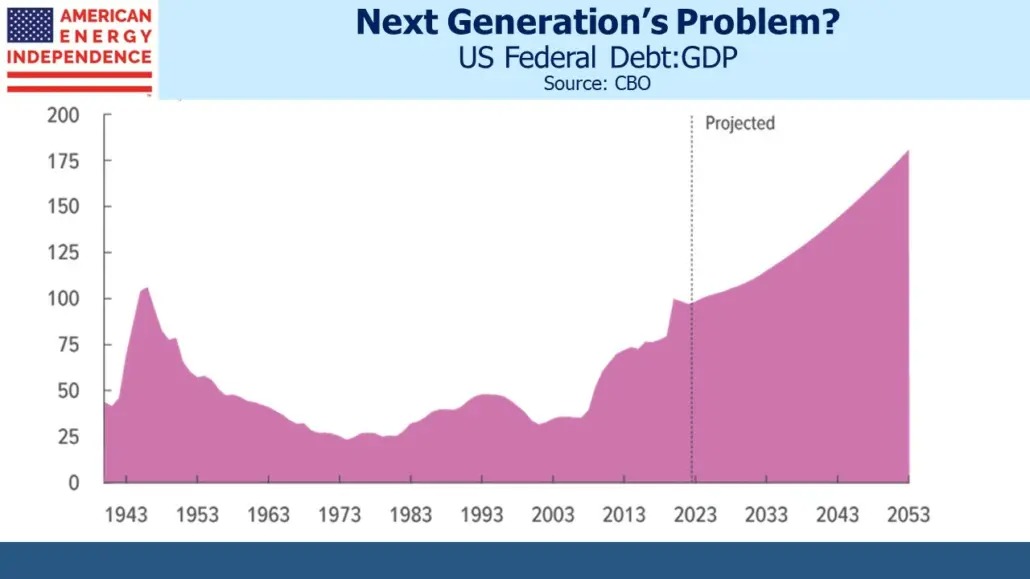
US Debt:GDP is 1.0X and the Fed owns 15% of our bonds. In Japan the equivalent metrics are 2.4X and 43%. Deflation has been a persistent problem for Japan. But US voters would not long tolerate the anemic GDP growth that accompanied it — 0.6% pa over the past decade in Japan vs 2.5% pa in the US. Fiscal stimulus would be an electoral winner.
This is why higher US inflation remains likely.
—
Originally Posted June 26, 2024 – Monetary Policy Is Increasing The Deficit
Disclosure: SL Advisors
Please go to following link for important legal disclosures: http://sl-advisors.com/legal-disclosure
SL Advisors is invested in all the components of the American Energy Independence Index via the ETF that seeks to track its performance.
Disclosure: Interactive Brokers
Information posted on IBKR Campus that is provided by third-parties does NOT constitute a recommendation that you should contract for the services of that third party. Third-party participants who contribute to IBKR Campus are independent of Interactive Brokers and Interactive Brokers does not make any representations or warranties concerning the services offered, their past or future performance, or the accuracy of the information provided by the third party. Past performance is no guarantee of future results.
This material is from SL Advisors and is being posted with its permission. The views expressed in this material are solely those of the author and/or SL Advisors and Interactive Brokers is not endorsing or recommending any investment or trading discussed in the material. This material is not and should not be construed as an offer to buy or sell any security. It should not be construed as research or investment advice or a recommendation to buy, sell or hold any security or commodity. This material does not and is not intended to take into account the particular financial conditions, investment objectives or requirements of individual customers. Before acting on this material, you should consider whether it is suitable for your particular circumstances and, as necessary, seek professional advice.

