It sounds like an exaggeration, but I honestly can’t remember when a single company’s earnings were viewed as consequential to the broad market’s health as Nvidia’s (NVDA) are today. The closest parallel that I could come up with was Cisco (CSCO) in 1999 or 2000, when CSCO was the key supplier to the internet craze, analogous to NVDA’s role in the current AI enthusiasm.
I will confess that I had a role in the current NVDA scrutiny, though I believe that I was a bit ahead of the curve when I described NVDA earnings as a potential “big risk event” during a CNBC visit over a week ago. Heck, my mother-in-law, who is (1) a voracious consumer of financial media, (2) an active trader who is long NVDA, and (3) quite sparing with anything that might be remotely construed as praise for her son-in-law, acknowledged that I was the first person she heard to raise the now-current concerns. But we won’t know until later today and tomorrow whether these concerns are indeed warranted.
NVDA’s recent price action is at the root of the concern. Even after a couple of days of modest declines, the stock is up about 40% year-to-date and also since it’s last report. (Bear in mind that the year is less than two months old!). The stock has more than tripled in the past year. It’s a juggernaut – deservedly so. The company has been beating revenue and earnings expectations for the last four quarters even while raising guidance throughout. But NVDA’s stellar performance reduces the margin of error. As we wrote on February 12th:
It is clear that market expectations either for Q4 results or forward guidance are well above those embodied by analysts. If the market was satisfied with analysts’ expectations, we wouldn’t see this stock rocketing higher. That means that there is tremendous room for disappointment. Considering NVDA’s index weights and psychological importance, a sell-off in that stock would indeed impact the indices.
Can the investors be satisfied if earnings merely meet the $4.84 EPS consensus or if revenues don’t substantially exceed the $21.4 billion estimate? If not, what is indeed the correct “whisper number”? And what if the company merely reaffirms guidance? Analysts are already pricing in growth that almost any investor would consider extraordinarily enviable, yet the stock appears to be pricing in something that surpass the already lofty expectations.
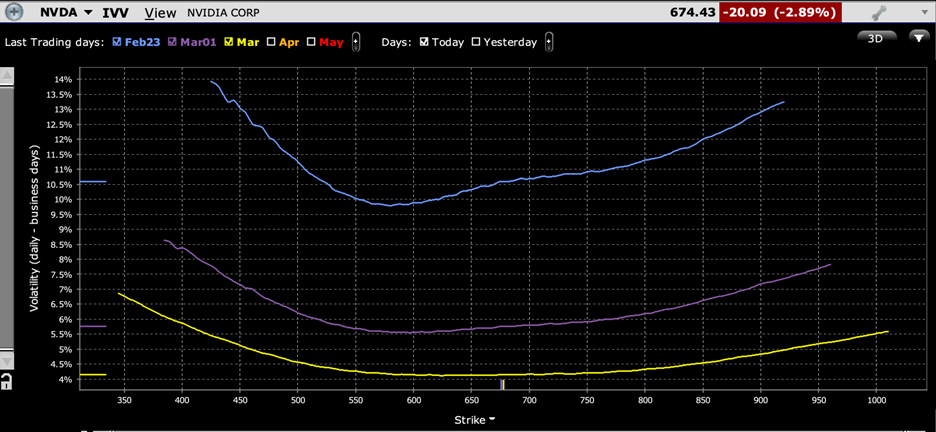
This is not an idle concern. NVDA did little after its last two earnings reports even after beating estimates on all fronts and raising guidance. These came after two stellar rallies three and four quarters ago. After the last four moves of -2.46%, +0.1%, +24.37% and 14.02%, it is hardly surprising that at-money options expiring Friday imply 10.6% daily moves between now and the end of the week:
NVDA Implied Volatilities by Strike for Options Expiring February 23rd (blue), March 1st (purple), March 15th (yellow)

Source: Interactive Brokers
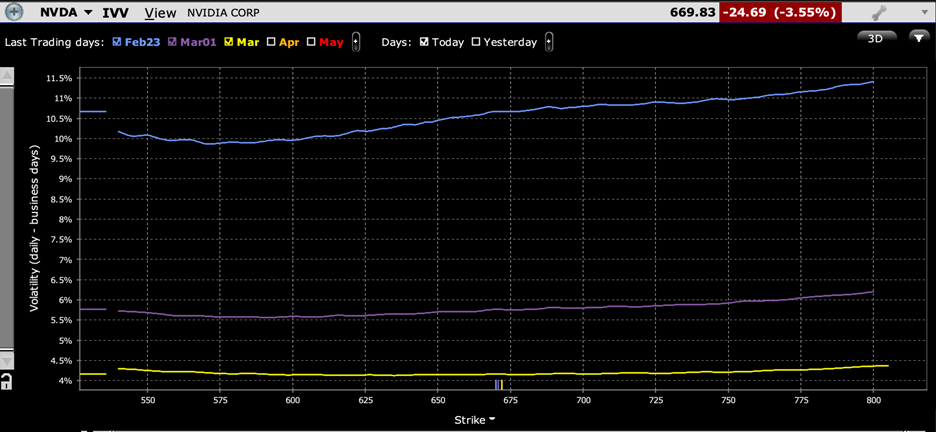
The fascinating part is the shape of the curves, or the skew. The strike space in the graph above represents 3 standard deviation moves from the current level. Considering the recent volatility of NVDA, that gives us a roughly $650 wide X-axis. On that wide of a scale, we see a relatively normal “Elvis smile”, with downside strikes sloping up more steeply than those to the upside. But it’s a bit misleading, since the low ebb is in the $590-$600 range — over 10% below the current stock price. When we zoom in a bit to show a strike space of 20% ,we see a rather strangely shapely skew:
NVDA Implied Volatilities by Strike for Options Expiring February 23rd (blue), March 1st (purple), March 15th (yellow)

Source: Interactive Brokers
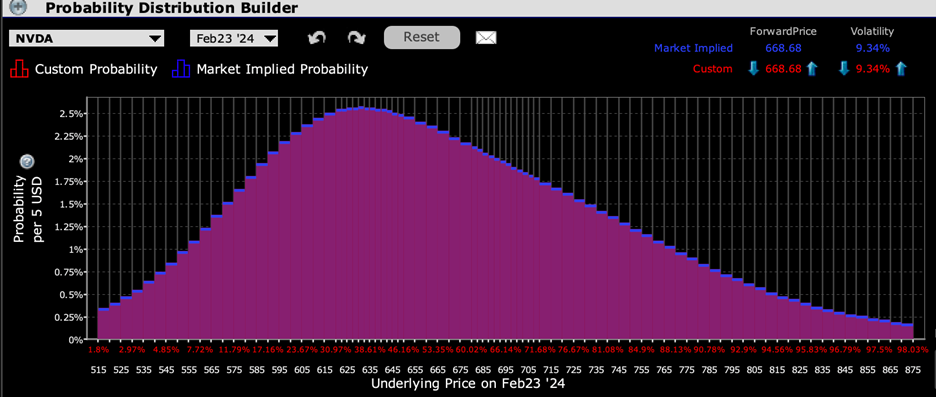
Not that the skews are either pancake flat, or actually upward sloped. This tells us that FOMO is still in play. Traders are more willing to risk a downside move than an upward one, even after a couple of down days for NVDA. That said, the IBKR Probability Lab shows a peak in the $625-$640 range for options expiring Friday. It’s not so much that traders aren’t hedging the downside at all, but more that they are willing to speculate on a wide range of positive outcomes.
IBKR Probability Lab for NVDA Options Expiring February 23rd, 2024

Source: Interactive Brokers
It is also important to note that even as NVDA has experienced a modest recent pullback from recent record highs, other high-flying AI names like SMCI and ARM have pulled back more substantially from even steeper moves. We have also seen some risk aversion creep back into the broader market, with VIX trading in the 15-16 range after being mired in a 12.5-14 level. The current levels don’t imply a historically notable amount of demand for volatility protection, but they are more historically normal. Bottom line – we’ve seen some risk aversion creep back in NVDA’s options, AI-related stocks, and the broader markets in general. We’ll know if those concerns will be justified soon enough.
Disclosure: Interactive Brokers
The analysis in this material is provided for information only and is not and should not be construed as an offer to sell or the solicitation of an offer to buy any security. To the extent that this material discusses general market activity, industry or sector trends or other broad-based economic or political conditions, it should not be construed as research or investment advice. To the extent that it includes references to specific securities, commodities, currencies, or other instruments, those references do not constitute a recommendation by IBKR to buy, sell or hold such investments. This material does not and is not intended to take into account the particular financial conditions, investment objectives or requirements of individual customers. Before acting on this material, you should consider whether it is suitable for your particular circumstances and, as necessary, seek professional advice.
The views and opinions expressed herein are those of the author and do not necessarily reflect the views of Interactive Brokers, its affiliates, or its employees.
Disclosure: Probability Lab
The projections or other information generated by the Probability Lab tool regarding the likelihood of various investment outcomes are hypothetical in nature, do not reflect actual investment results and are not guarantees of future results. Please note that results may vary with use of the tool over time.
Disclosure: Options Trading
Options involve risk and are not suitable for all investors. Multiple leg strategies, including spreads, will incur multiple commission charges. For more information read the “Characteristics and Risks of Standardized Options” also known as the options disclosure document (ODD) or visit ibkr.com/occ

