Skechers U.S.A., Inc. SKX delivered second-quarter 2024 results, with the top and bottom lines lagging the Zacks Consensus Estimate. Sales improved but earnings declined year over year. Challenges such as supply-chain disruptions, foreign currency headwinds, regulatory issues in India, and weakened consumer demand in China impacted the overall performance.
However, the company continued to focus on product innovation, emphasizing comfort technologies and strategic partnerships. Comprehensive marketing efforts, including new channels for football and basketball products, supported brand growth. Skechers remains committed to its goal of reaching $10 billion in annual sales by 2026.
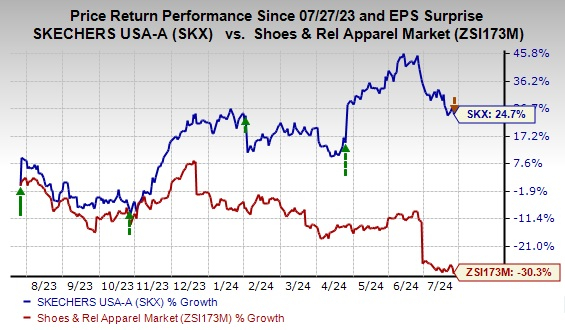
Over the past year, shares of this Zacks Rank #1 (Strong Buy) company have gained 24.7% against the industry’s 30.3% decline.
Q2 Highlights
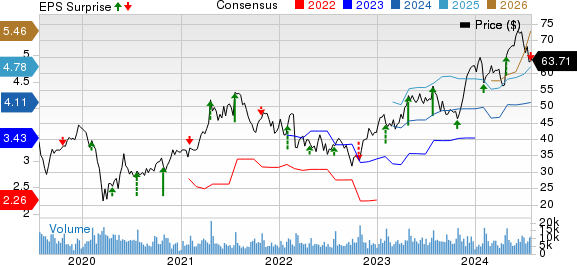
Skechers posted second-quarter earnings of 91 cents per share, missing the Zacks Consensus Estimate for earnings of 94 cents. Also, the bottom line declined 7.1% from the year-earlier quarter.
SKX generated sales of $2,157.6 million, lagging the consensus estimate of $2,219 million. However, the top line grew 7.2% year over year, driven by a 6.9% rise in international sales and a 7.7% increase in domestic sales. Improvements in domestic and international sales were driven by robust DTC and Wholesale sales. On a constant-currency basis, total sales grew 8.7%.
The company’s wholesale sales increased 5.5% year over year to $1.13 billion, while DTC rose 9.2% to $1.03 billion. Our estimate for wholesale and DTC sales was pegged at $1.15 billion and $1.05 billion, respectively.
Wholesale sales increased 10.3% year over year in the Americas (“AMER”), and 3.9% in Europe, the Middle East & Africa (EMEA), partially offset by a decrease of 2.6% in the Asia Pacific (“APAC”). Wholesale average selling price declined 0.8%, whereas the unit volume increased 6.4% year over year.
DTC sales growth included increases of 1.4% in domestic DTC sales and 15.2% in international DTC sales. The DTC unit volume rose 10.2% and the average selling price declined 1%. Also, growth of 4.1% in the AMER, 5.8% in the APAC and 40.6% in the EMEA aided the segment’s performance.
Region-wise, sales increased 7.2% year over year to $1.10 billion in the AMER, 13.7% to $492.5 million in the EMEA and 2.2% to $564.2 million in the APAC. We expected sales from the AMER, EMEA and APAC regions to increase 8.9%, 7.5% and 11.6%, respectively, for the quarter under review.

Image Source: Zacks Investment Research
Margins & Costs
Gross profit increased 11.7% year over year to $1.18 billion. Also, the gross margin expanded 220 basis points (bps) to 54.9%, primarily driven by lower costs per unit due to a decline in freight costs and a favorable mix of DTC volumes. We estimated the metric to expand 70 bps to 53.4% for the quarter under review.
Total operating expenses grew 16% year over year to $977.9 million. The metric, as a percentage of sales, increased 340 bps to 45.3%. We expected total operating expenses to rise 15.5% for the quarter.
Selling expenses grew 26.1% from the year-ago period to $235.9 million. Also, general and administrative expenses jumped 13.2% to $742 million. Increased costs resulted from higher brand demand creation expenditure, along with elevated labor and facility costs, such as rent and depreciation.
Other Financial Aspects
As of Jun 30, 2024, cash and cash equivalents totaled $1.28 billion, whereas short-term investments amounted to $130.1 million.
Skechers ended the quarter with long-term borrowings of $45.7 million and shareholders’ equity of $4.22 billion, excluding non-controlling interests of $292.3 million. The company incurred a capital expenditure of $169.5 million in the quarter.
In the second quarter of 2024, management repurchased 0.9 million shares of its Class A common stock for $60 million. The company’s board authorized a new $1-billion share repurchase program.
Store Update
As of Jun 30, 2024, SKX had 5,267 stores, including 576 domestic stores, 1,126 international locations, and 3,565 distributors, licensee and franchise stores.
In the second quarter, the company opened 25 domestic stores, 98 international stores, and 194 distributors, licensee and franchise stores. It closed 12 domestic stores, 57 international stores, and 149 distributor, licensee and franchise stores in the same period.
Outlook
For 2024, management targets sales between $8.88 billion and $8.98 billion compared with the previously mentioned $8.73 billion and $8.88 billion. It predicts earnings per share (“EPS”) between $4.08 and $4.18 compared with the previously stated $3.95 and $4.10. Management anticipates a capital expenditure of $325-$375 million for 2024.
For the third quarter of 2024, SKX is likely to achieve sales between $2.30 billion and $2.35 billion and EPS between $1.10 and $1.15.
Other Solid Picks
Some other top-ranked stocks in the retail space are The Gap, Inc. GPS, Abercrombie & Fitch Co. ANF and Stitch Fix SFIX.
Gap is a premier international specialty retailer, which offers a diverse range of clothing, accessories and personal care products. It currently sports a Zacks Rank #1.
The Zacks Consensus Estimate for Gap’s fiscal 2024 earnings and sales indicates growth of 22.4% and 0.2%, respectively, from fiscal 2023 reported figures. GPS has a trailing four-quarter average earnings surprise of 202.7%.
Abercrombie is a specialty retailer of premium, high-quality casual apparel. It flaunts a Zacks Rank of 1 at present. ANF delivered a 28.9% earnings surprise in the last reported quarter.
The consensus estimate for Abercrombie’s fiscal 2024 earnings and sales indicates growth of 47.3% and 10.4%, respectively, from the fiscal 2023 reported levels. ANF has a trailing four-quarter average earnings surprise of 210.3%.
Stitch Fix is a leading online personal styling service. It currently has a Zacks Rank of 2 (Buy).
The Zacks Consensus Estimate for Stitch Fix’s fiscal 2024 earnings indicates growth of 22.6% from the year-ago actuals. SFIX has a trailing four-quarter average earnings surprise of 14.5%.
Market News and Data brought to you by Benzinga APIs
© 2024 Benzinga.com. Benzinga does not provide investment advice. All rights reserved.


