What a difference a week makes. At this time last Friday stocks were selling off sharply thanks to a better-than-expected jobs report. It revealed the equity market’s somewhat seemingly obvious preference for rate cuts over a solid economy. Today, however, we had some solid economic reports and we rallied. That’s not the only sign that the underlying market psychology has done a quick about-face.
While I don’t know of anyone who was paying nearly the attention to Housing Starts and Industrial Production today than they were to last weeks Nonfarms Payrolls, but this morning’s data was almost shockingly positive. Housing Starts rose by 15.8% in December, way above the 3.0% consensus, and Industrial Production rose 0.9%, well north of its 0.3% consensus. It may be that the economy is taking a solid turn for the better. Or it could be that builders and manufacturers wanted to get ahead of potential tariffs. We won’t know for sure until after the new administration takes office on Monday.
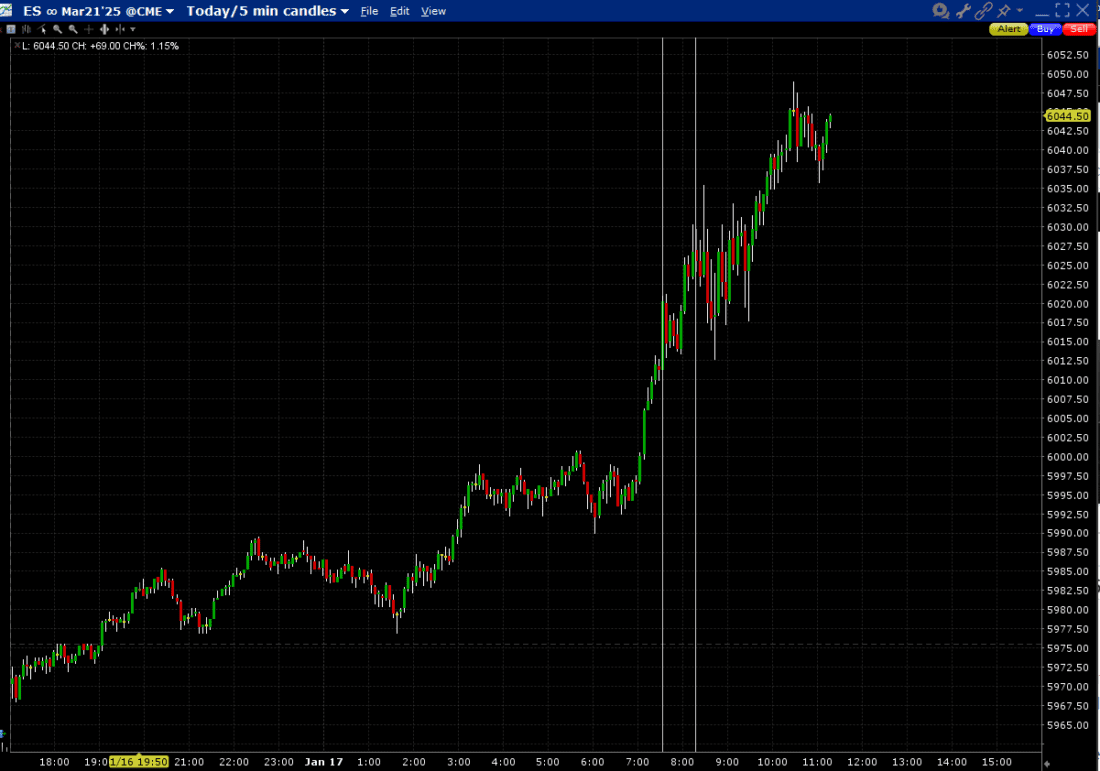
It seems much more plausible to believe that today’s rally is more about enthusiasm for Monday’s events – when US stock markets happen to be closed for Martin Luther King Day – than today’s data. The chart below shows that pre-market futures began to rally in advance of this morning’s economic reports, marked with vertical lines in the chart below:
ES March Futures, 1-Day, including pre-market, 5-Minute Bars, with vertical lines at 7:30 and 8:15 CST

Source: Interactive Brokers
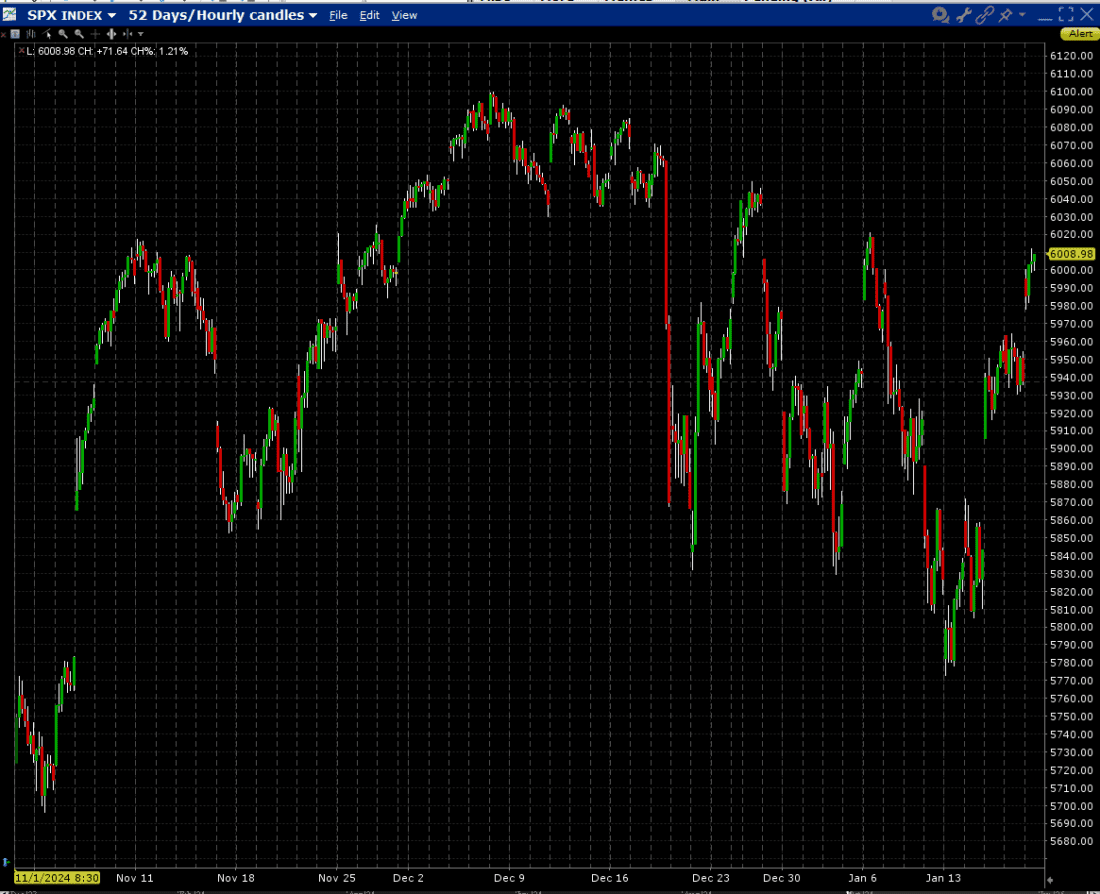
To be fair, some of the rally could be related to this morning’s monthly expiration of AM-expiring index futures. While much of the activity in S&P 500 (SPX) Index options has migrating to daily, PM-expiring options, there was still about 75,000 open interest in this morning’s 5950 strike. A definitive move through that level (bearing in mind that March futures have a fair value about 36 points above cash), could certainly have propelled the futures higher regardless of reason. Thus, instead, of focusing on today’s pre-market economic reports, it seems quite fair to look at today’s rally as a new flourishing of the “Trump Trade.” Earlier this week, SPX had given back all of its post-election gains; we’re now back to the levels that prevailed in the first days after the election:
SPX Since November 1st, Hourly Candles

Source: Interactive Brokers
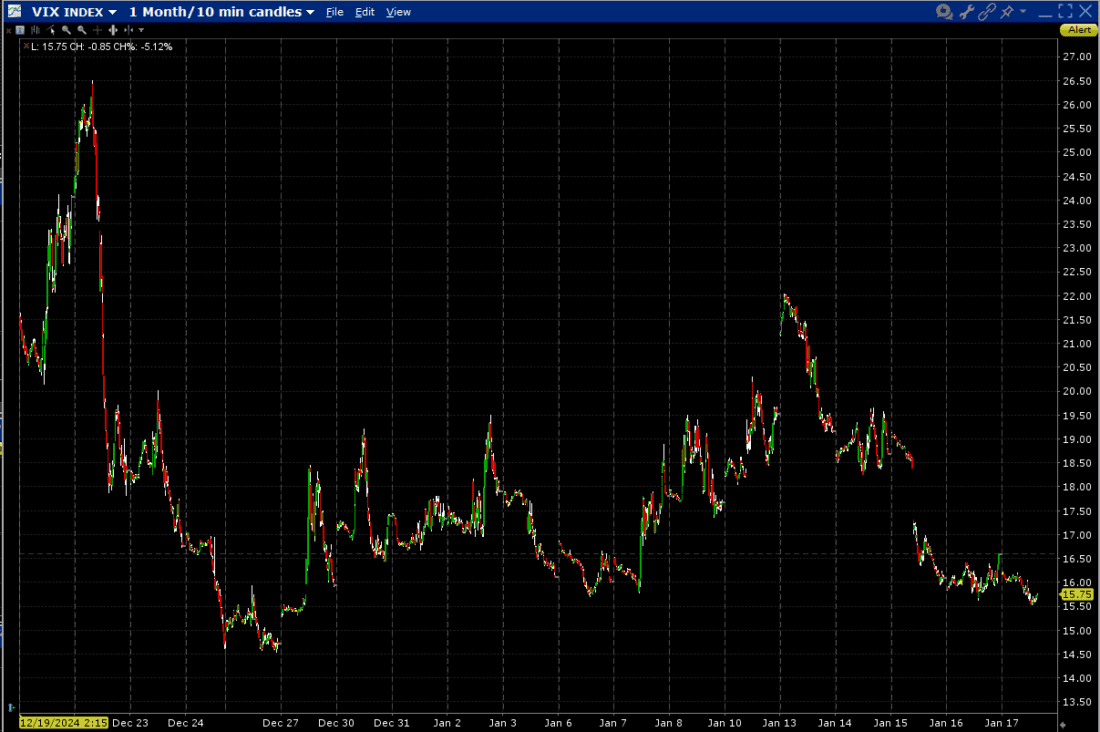
It is said that nothing changes sentiment like price, and it is quite clear that traders have become significantly more sanguine about the prospects for future volatility – or the lack thereof – in recent days. Earlier this week, the Cboe Volatility Index (VIX) ticked above. Now it has a 15 handle. While I have always noted that VIX is constructed as the market’s best estimate of volatility over the coming 30 days, not a “fear gauge”, it does reveal much about institutions’ demand for hedging protection. Either way, expectations for future volatility and/or demand for hedges has fallen sharply as this week wore on:
VIX, 1-Month, 10-Minute Candles

Source: Interactive Brokers
Thinking strictly from a volatility perspective, it seems unlikely that there will be a dearth of potentially market-moving events in the coming 30 days. The potential for executive orders addressing tariffs and immigration could affect markets as early as Tuesday. Then we move into the bulk of earnings season. Early results from major banks have been encouraging, but the factors that affect their earnings are far more idiosyncratic than a typical company’s. Instead, the key will be whether companies can maintain their guidance when SPX earnings are widely expected to grow by a robust 13-15% in 2025. Any potential shortfalls might be dealt with rather harshly. And although no action is expected from the January 29th FOMC meeting, the market will be poised to react to any signals about the path of future rate cuts.
Any or all of this could come to pass. But it seems like an opportune time to consider their risks when volatility protection has suddenly become much cheaper, no?
Disclosure: Interactive Brokers
The analysis in this material is provided for information only and is not and should not be construed as an offer to sell or the solicitation of an offer to buy any security. To the extent that this material discusses general market activity, industry or sector trends or other broad-based economic or political conditions, it should not be construed as research or investment advice. To the extent that it includes references to specific securities, commodities, currencies, or other instruments, those references do not constitute a recommendation by IBKR to buy, sell or hold such investments. This material does not and is not intended to take into account the particular financial conditions, investment objectives or requirements of individual customers. Before acting on this material, you should consider whether it is suitable for your particular circumstances and, as necessary, seek professional advice.
The views and opinions expressed herein are those of the author and do not necessarily reflect the views of Interactive Brokers, its affiliates, or its employees.

