Soft landings, it has been said, are the holy grail of monetary policy, and there may be signs that we’re on the cusp of one.
Soft landings, it has been said, are the holy grail of monetary policy, and there may be signs that we’re on the cusp of one. But what does it mean for the economy in 2024 to have a soft landing? And conversely, what constitutes a hard landing?
Simply put, a soft landing occurs when the Federal Reserve manages to curb inflation without triggering a sharp increase in unemployment or pushing GDP growth into negative territory.
A hard landing, on the other hand, is when interest rates rise and inflation decreases, but at the cost of a recession and high unemployment.
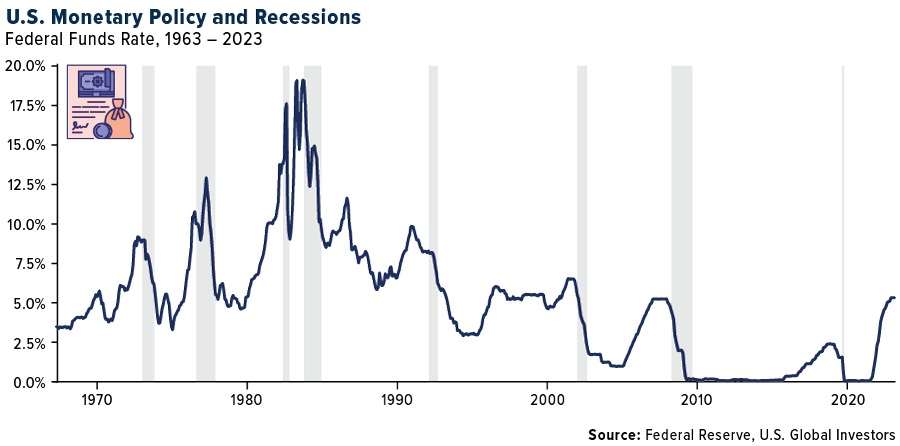
Achieving a soft landing is exceptionally challenging. Noted MIT economist Rudi Dornbusch (1942-2002) famously quipped: “None of the post-war expansions died of old age. They were all murdered by the Fed.” Indeed, out of nine tightening cycles over the past five decades, the bank successfully engineered a soft landing only twice. The other seven instances culminated in recessions.

Princeton economics professor Alan Blinder offers some hope. If the need to combat inflation is not too extreme, he writes in a recent article, the Fed has demonstrated its ability to orchestrate an economic landing that either avoids a recession or induces a relatively mild one. The central bank’s reputation for causing hard landings “derives mainly from conquering the 1970s inflation—which took three landings,” Blinder says.
The key to predicting the outcome in 2024 lies in economic indicators, especially as experts project the consumer price index (CPI) in the U.S. to decline to 2.7% while the Fed’s target rate is expected to reach 4.50% by the end of the year.
A Global Leader In Numerous Industries
Despite the occasional gloomy predictions and forecasts, investors should be cautious about buying into the “America-is-in-decline” narrative, Merrill points out in its weekly Capital Market Outlook.
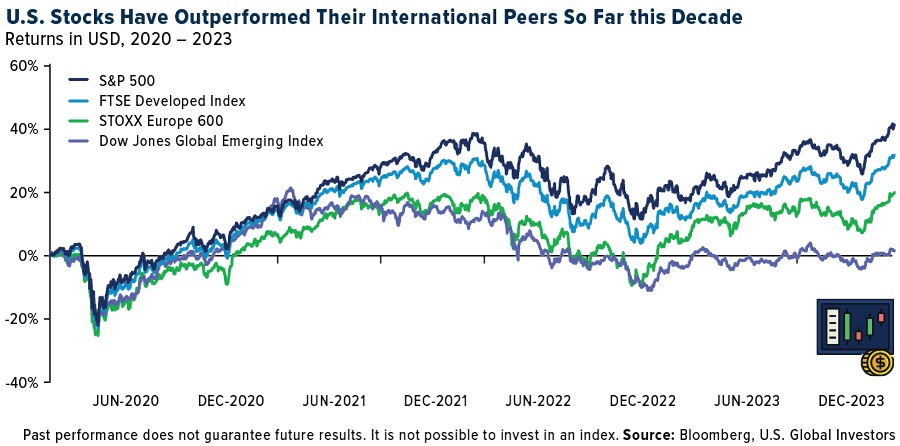
America’s share of global gross domestic product (GDP), estimated at 26% for 2023, has increased from 24.8% at the start of the decade. Over the past four years, the U.S. economy has added an additional $6 trillion to its economic base, bringing total U.S. output to around $27 trillion. Most impressively, since the beginning of the decade, the S&P 500 has consistently outperformed most developed and emerging markets.

Investors have been treated to a promising holiday season, characterized by strong consumption. Mastercard reports a year-over-year increase of +3.1% in U.S. retail sales, excluding automobiles, during the 2023 holiday shopping season from November 1 through December 24. This measure encompasses both in-store and online retail sales across all payment forms and is not adjusted for inflation.
Finally, the Santa Claus rally appears to be in place. This phenomenon describes a period where the stock market closes higher during the last five trading days of the current year and the first three trading days of the new year.
“Where else in the world is there an economy that leads or dominates in so many diverse industries, ranging from agriculture to aerospace, education to entertainment, and technology to transportation, to name just a few sectors?” asks Joseph Quinlan, head of Merrill’s market strategy.
I couldn’t have said it better myself.
Gold’s Prospects In A Soft-Landing Scenario
In the context of a potential soft landing, historical trends suggest that gold may not perform as strongly. According to the World Gold Council (WGC), soft landing environments have typically resulted in flat to slightly negative average returns for gold.
However, every cycle is unique, and 2024 may bring surprises.
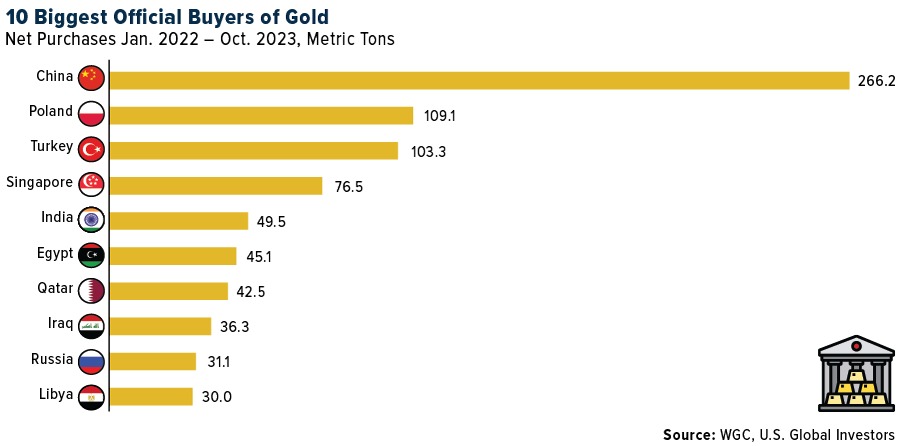
Heightened geopolitical tensions in a key election year for many major economies, combined with continued central bank buying, could provide additional support for gold. Central banks and official institutions have played a pivotal role in boosting gold’s performance over the past two years, with the WGC estimating that excess central bank demand added 10% or more to gold’s gains in 2023. This trend is likely to persist, potentially providing an extra boost to gold prices in 2024.

In the event that a recession becomes a reality, weaker growth could help steer inflation back toward central bank targets, eventually leading to interest rate cuts. Such an environment has been conducive to both gold and high-quality government bonds, making them appealing options for investors, the WGC says.
As we enter 2024, it’s essential for investors to remain vigilant, monitor economic indicators closely and consider the various possibilities that lie ahead. While the prospect of a soft landing offers optimism, the financial landscape remains subject to change. By recognizing the strength of the U.S. in the global economy and staying attuned to market dynamics, investors can position themselves for success in the new year.
—
Originally Posted January 2, 2024 – The Federal Reserve’s Balancing Act Between Inflation And Growth
All opinions expressed and data provided are subject to change without notice. Some of these opinions may not be appropriate to every investor. By clicking the link(s) above, you will be directed to a third-party website(s). U.S. Global Investors does not endorse all information supplied by this/these website(s) and is not responsible for its/their content.
The Consumer Price Index (CPI) is a measure of the average change in prices over time for a market basket of consumer goods and services.
The S&P 500 is widely regarded as the best single gauge of large-cap U.S. equities and serves as the foundation for a wide range of investment products. The index includes 500 leading companies and captures approximately 80% coverage of available market capitalization. The STOXX Europe 600 Index is derived from the STOXX Europe Total Market Index (TMI) and is a subset of the STOXX Global 1800 Index. With a fixed number of 600 components, the STOXX Europe 600 Index represents large, mid and small capitalization companies across 17 countries of the European region. The Dow Jones Global Emerging Index measures the performance of stocks that trade in emerging markets. It represents approximately 95% of the float-adjusted market capitalization of the countries covered by index. The FTSE Developed Index is a market cap weighted index representing the performance of the large & mid cap stocks from the developed countries within the FTSE Global Equity Index Series.
Disclosure: US Global Investors
All opinions expressed and data provided are subject to change without notice. Holdings may change daily.
Some of these opinions may not be appropriate to every investor. By clicking the link(s) above, you will be directed to a third-party website(s). U.S. Global Investors does not endorse all information supplied by this/these website(s) and is not responsible for its/their content.
About U.S. Global Investors, Inc. – U.S. Global Investors, Inc. is an investment adviser registered with the Securities and Exchange Commission (“SEC”). This does not mean that we are sponsored, recommended, or approved by the SEC, or that our abilities or qualifications in any respect have been passed upon by the SEC or any officer of the SEC.
This commentary should not be considered a solicitation or offering of any investment product.
Certain materials in this commentary may contain dated information. The information provided was current at the time of publication.
Some links above may be directed to third-party websites. U.S. Global Investors does not endorse all information supplied by these websites and is not responsible for their content.
Please consider carefully a fund’s investment objectives, risks, charges and expenses. For this and other important information, obtain a fund prospectus by clicking here or by calling 1-800-US-FUNDS (1-800-873-8637). Read it carefully before investing. Foreside Fund Services, LLC, Distributor. U.S. Global Investors is the investment adviser.
Disclosure: Interactive Brokers
Information posted on IBKR Campus that is provided by third-parties does NOT constitute a recommendation that you should contract for the services of that third party. Third-party participants who contribute to IBKR Campus are independent of Interactive Brokers and Interactive Brokers does not make any representations or warranties concerning the services offered, their past or future performance, or the accuracy of the information provided by the third party. Past performance is no guarantee of future results.
This material is from US Global Investors and is being posted with its permission. The views expressed in this material are solely those of the author and/or US Global Investors and Interactive Brokers is not endorsing or recommending any investment or trading discussed in the material. This material is not and should not be construed as an offer to buy or sell any security. It should not be construed as research or investment advice or a recommendation to buy, sell or hold any security or commodity. This material does not and is not intended to take into account the particular financial conditions, investment objectives or requirements of individual customers. Before acting on this material, you should consider whether it is suitable for your particular circumstances and, as necessary, seek professional advice.

