Learn about LLM and Generative AI with Part I.
Sentiment analysis of FOMC transcripts
FOMC transcripts refer to the financial records of the Federal Open Market Committee meetings. FOMC transcripts provide key insights into monetary policy, economic assessments, and future outlooks, shaping U.S. monetary policy and hence, the market sentiment and trading strategies.
The analysis begins with data collection from the Federal Reserve’s official website. The transcripts are then preprocessed to remove irrelevant sections and focus on content that reflects market sentiment. FinBERT is used to assign sentiment scores, helping traders gauge whether the sentiment is positive or negative.
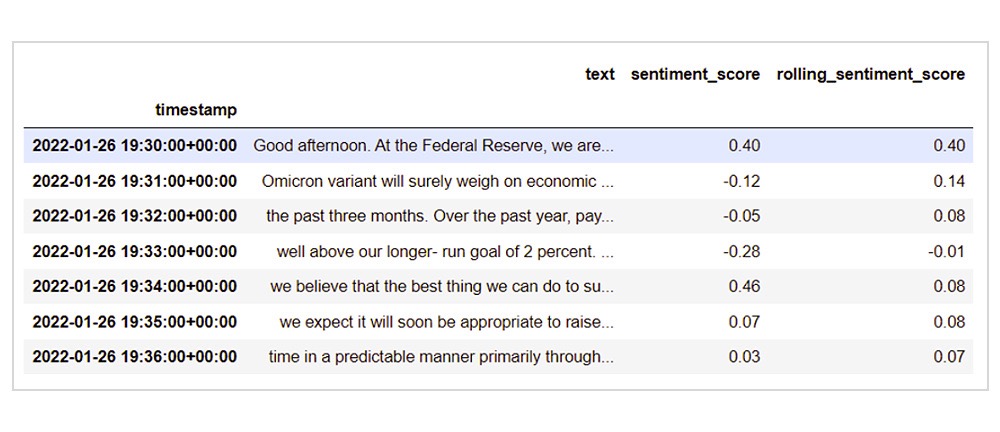
The following table represents sentiment scores of FOMC transcripts at a minute frequency. Each row corresponds to a specific minute during the transcript. For example, the meeting text from 19:30 to 19:31 is stored in the ‘text’ column and the sentiment score of this text, which is 0.395, is stored in the column ‘sentiment_score’.
This analysis helps quantify how the sentiment changes over time during the FOMC meeting.

Figure: Table with FOMC transcripts text at minute frequency and its sentiment score
Next, we will discuss the trading strategy based on sentiment analysis.
Trading strategy based on sentiment analysis
The strategy revolves around analysing rolling sentiment scores and establishing specific thresholds for trading decisions.
Generating Trade Signals: The first step involves calculating the rolling mean of sentiment scores, which reflects the average sentiment over the minute-wide data collected throughout the FED meeting. By averaging these scores, traders can gauge the prevailing market sentiment and make informed trading decisions based on the trends observed.
You can find the rolling sentiment score in the ‘rolling_sentiment_score’ column in the following table. It should be noted that the sentiment score values are rounded off to two decimals.

Figure: Table with FOMC transcripts text with their sentiment score and rolling sentiment score.
For example, the rolling sentiment score at 19:30:00 (0.14) is an average of sentiment scores so far, which is an average of 0.4 and -0.12.
Similarly, the rolling sentiment score at 19:32:00 (0.08) is an average of 3 sentiment scores 0.4, -0.12, -0.05.
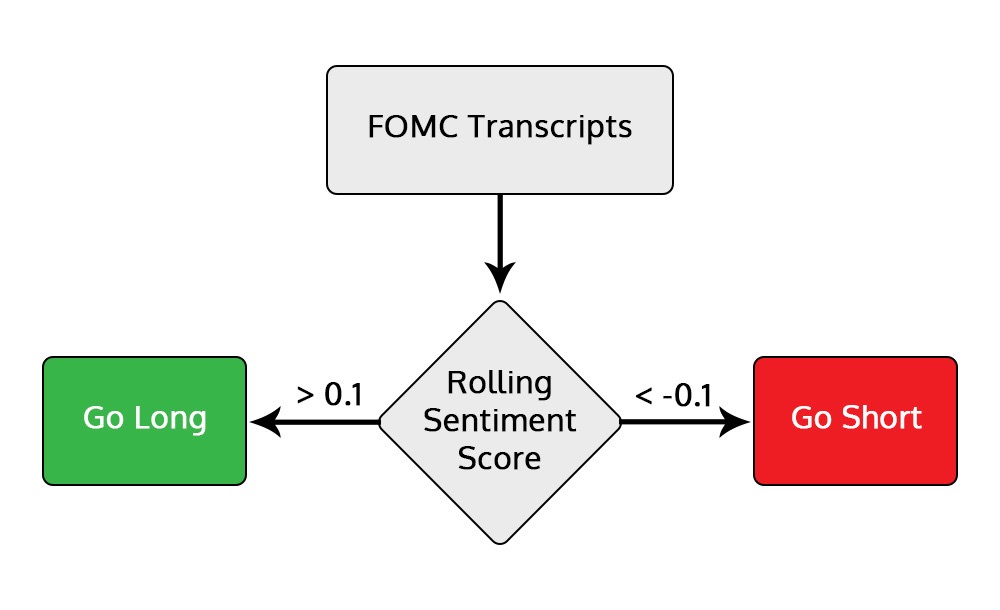
Setting Thresholds: In this strategy, a sentiment score greater than 0 indicates positive sentiment, while a score below 0 suggests negative sentiment. In this example, a threshold of 0.1 will be used.
Entry and Exit Rules:

Figure: Entry rules of long and short position
Long Position: Enter when the rolling sentiment score is greater than 0.1. Exit the position either when the rolling sentiment falls below -0.1 or at the last minute of the FOMC meeting.
Short Position: Open a short position when the rolling sentiment score is less than -0.1. Exit when the rolling sentiment exceeds 0.1 or at the last minute of the FOMC meeting.
Let us now check out the real-world application of using some news or information and performing sentiment analysis on the same.
Stay tuned for the next installment to learn about real-world applications.
Originally posted on QuantInsti.
Disclosure: Interactive Brokers
Information posted on IBKR Campus that is provided by third-parties does NOT constitute a recommendation that you should contract for the services of that third party. Third-party participants who contribute to IBKR Campus are independent of Interactive Brokers and Interactive Brokers does not make any representations or warranties concerning the services offered, their past or future performance, or the accuracy of the information provided by the third party. Past performance is no guarantee of future results.
This material is from QuantInsti and is being posted with its permission. The views expressed in this material are solely those of the author and/or QuantInsti and Interactive Brokers is not endorsing or recommending any investment or trading discussed in the material. This material is not and should not be construed as an offer to buy or sell any security. It should not be construed as research or investment advice or a recommendation to buy, sell or hold any security or commodity. This material does not and is not intended to take into account the particular financial conditions, investment objectives or requirements of individual customers. Before acting on this material, you should consider whether it is suitable for your particular circumstances and, as necessary, seek professional advice.

