Happy new year to all, though it might not seem all that happy to those who are long equities and bonds this morning. When the calendar turned, a key catalyst that had been driving asset prices vanished. I described it as “weaponized FOMO” during a media appearance last week[i]. Allow me to explain.
Near the end of November we wrote the following:
Right now, you have portfolio managers in both equity and fixed income chasing performance into year-end. While individuals are often perceived as being more susceptible to FOMO, it actually hits professionals more directly. No portfolio manager wants to underperform his benchmark and peers, so they need to be afraid of missing out. Momentum has a way of becoming self-fulfilling.
Equity investors who didn’t want to touch stocks at the end of October couldn’t get enough of them into year-end once the stock rally took hold. Fixed income investors who shunned 10-year notes at a 5% yield were clamoring for them at a 3.9% level. Two well-received FOMC meetings were key positive catalysts, and it would be naïve or disingenuous to assert otherwise, but even they were insufficient to fully explain the reversal of sentiment in such a short period of time.
Window dressing seemed to be a factor as well. As a friend put it to me, “if you are getting 2 and 20, you have tremendous incentive to goose your returns into year-end.” What he meant was: investors who receive performance fees – including hedge funds – want to ensure that their performance is maximized during the calendar year. Riding an all-encompassing uptrend can help one achieve that goal.
Yet I was relying heavily on intuition and anecdotal evidence. Quite frankly, I wanted something more definitive. And I think I found it when I discovered the NAAIM Exposure Index.
According to the National Association of Active Investment Managers’ (NAAIM) website, here is part of the definition of their NAAIM Exposure Index:
The NAAIM Exposure Index represents the average exposure to US Equity markets reported by our members.
NAAIM member firms who are active money managers are asked each week to provide a number which represents their overall equity exposure at the market close on a specific day of the week, currently Wednesdays. Responses can vary widely as indicated below. Responses are tallied and averaged to provide the average long (or short) position of all NAAIM managers, as a group.
Range of Responses:
200% Leveraged Short
100% Fully Short
0% (100% Cash or Hedged to Market Neutral)
100% Fully Invested
200% Leveraged Long
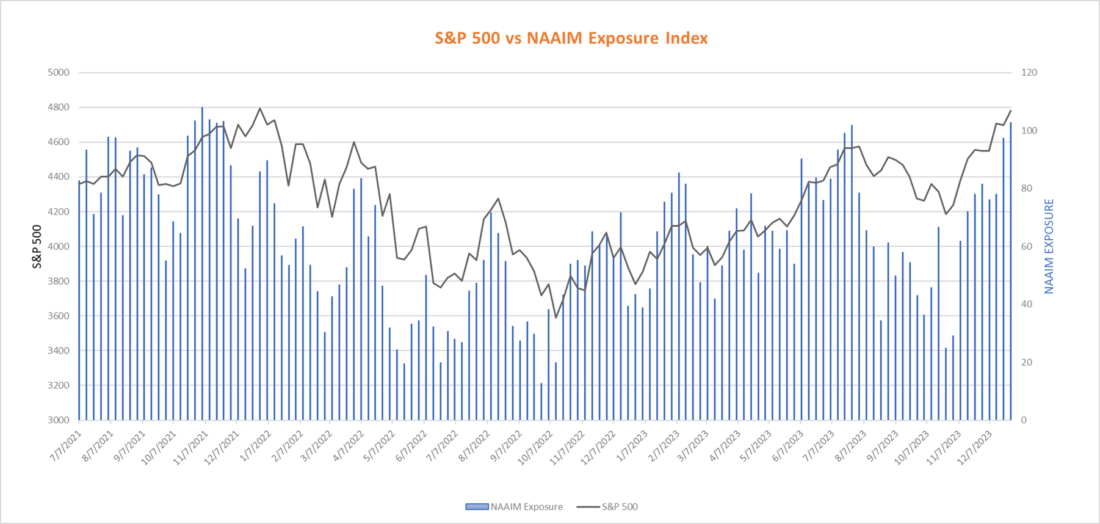
The NAAIM website helpfully allows us to download current and historical data into an Excel spreadsheet. After doing so, with a bit of formatting we were able to come up with the following graph:

Source: NAAIM, Interactive Brokers
The data appears to ratify our assumption – that institutional investors shifted quickly from underweight to overweight as the year came to a close. The index level jumped from 24.82 on October 25th to 102.71 on December 27th. Indeed, the survey recipients’ aggregate positioning went from barely above neutral to leveraged long in just two months. Is it any wonder that we saw the S&P 500 Index (SPX) rally sharply over that period?
Other times when we saw readings at or below the recent lows were May, June, and October 2022. The first two of those were followed by bear market rallies, and the last preceded a lasting bottom.
Other times when we saw readings above 100% were late July of this year, just before we began a three-month swoon, and November 2021. The NASDAQ 100 Index (NDX) peaked at that time, and SPX peaked shortly thereafter. Under that scenario, it is unsurprising that some profit-taking might ensue.
It is also important to note the current level of SPX vis-à-vis two years ago. For better or worse, the stellar rally that we saw in 2023 simply recouped the losses of 2022. Since the end of 2021, SPX is essentially unchanged and NDX is up about +1.5%. It is not impossible to assert that we have simply completed a two-year round trip.
One should never rely on a single indicator to guide trading and investment decisions. There are simply too many variables at play. But when we find data that fits a seemingly solid hypothesis, we should take it into consideration. On this basis, a bit of profit-taking after a series of year-end factors have abated seems quite understandable.
—
[i] Starting at the 5:15 mark of this video
Disclosure: Interactive Brokers
The analysis in this material is provided for information only and is not and should not be construed as an offer to sell or the solicitation of an offer to buy any security. To the extent that this material discusses general market activity, industry or sector trends or other broad-based economic or political conditions, it should not be construed as research or investment advice. To the extent that it includes references to specific securities, commodities, currencies, or other instruments, those references do not constitute a recommendation by IBKR to buy, sell or hold such investments. This material does not and is not intended to take into account the particular financial conditions, investment objectives or requirements of individual customers. Before acting on this material, you should consider whether it is suitable for your particular circumstances and, as necessary, seek professional advice.
The views and opinions expressed herein are those of the author and do not necessarily reflect the views of Interactive Brokers, its affiliates, or its employees.

