Key takeaways
Markets don’t care about elections
Presidential elections haven’t historically affected markets or the economy, regardless of the winner or their party.
Stay fully invested
Staying invested during Democratic and Republican administrations did better than investing only during single-party rule.
Policy over politics
Monetary policy has had a greater market impact. Presidents historically were either helped or hurt by Federal Reserve actions.
With both conventions in the rearview mirror, the 2024 presidential election draws ever closer. Current vice president Kamala Harris officially accepted the Democratic nomination. She is running against former president and current Republican nominee Donald Trump. Investors may think the stock market does better under one party or the other. But US history suggests the market doesn’t care about the president or their party for many reasons.
Markets have done well under both parties
Neither party can claim superior economic or market performance. The stock market posted positive returns across most administrations, with the rare exceptions of presidencies that ended in deep recessions. The S&P® 500 Index has delivered an average annual return of approximately 10% since it started in 1957 through both Democratic and Republican administrations.1 The US economy also expanded around 3% during that period.2
The stock market’s return was negative for a presidential administration only when the country was in a financial crisis (2008) or experiencing a stagflationary spiral (1973).3
Investing and politics don’t mix
Hypothetically, the best-performing portfolio from 1900 to 2023 was the “bipartisan” one that stayed fully invested during both Democratic and Republican administrations. Starting with $10,000, this portfolio grew to almost $9.9 million.
A “partisan” portfolio, only invested during administrations of one party or the other in that 123-year span, underperformed by millions of dollars. The same $10,000 only invested during Democratic administrations grew to approximately $528,000. Invested only during Republican administrations, the initial $10,000 rose to just shy of $181,000.4
The different results are, in part, because of the US stock market’s consistent rise even during two world wars and major financial crises (the Great Depression and the 2008-2009 Global Financial Crisis). The more time investors spent participating in markets, the better their investments did.
Staying fully invested vs. choosing political sides
Growth of $10,000 in the Dow Jones Industrial Average since 1896
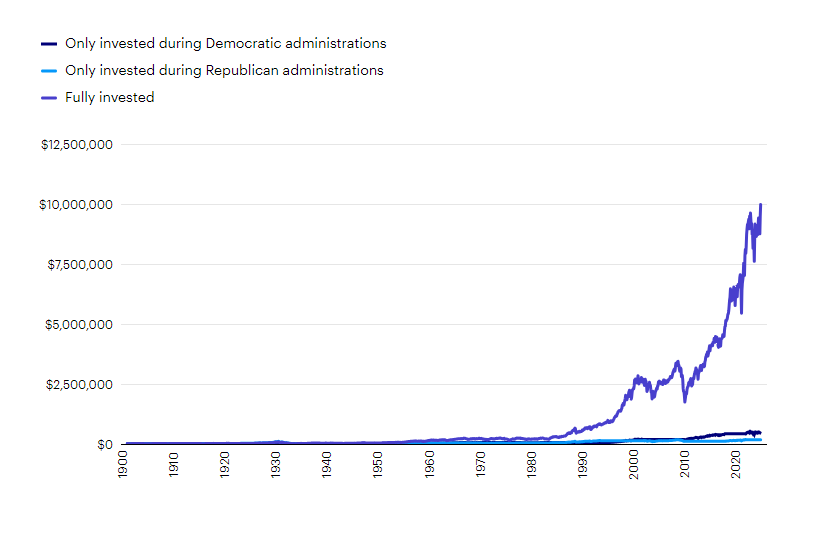
Sources: Haver, Invesco, 12/31/23. The Dow Jones Industrial Average is a price-weighted index of the 30 largest, most widely held stocks traded on the New York Stock Exchange. An investment cannot be made in an index. Past performance does not guarantee future results.
US economy doesn’t radically change
Investors are often concerned that elected officials will radically re-engineer the economy. In fact, the composition of the US economy has been consistent for decades. Even single-party rule periods didn’t result in significant change. The percentage of “substantive” bills by Congressional term hasn’t increased when one party controlled the executive and legislative branches.5
Neither party is fiscally responsible
Federal spending has outpaced taxes and other sources of government revenue in most years and across most administrations.6 No party can claim fiscal responsibility. It hasn’t been a significant issue for a variety of reasons, including the US having the world’s largest reserve currency and nominal economic growth outpacing the interest expense as a percent of gross domestic product (GDP).
Monetary policy matters more
For all the focus on the executive branch, I’d argue that it’s monetary policy that matters more. The old adage holds true: Don’t fight the Fed. Historically, presidents have been hurt or helped by monetary policy conditions. For instance, both Presidents Reagan and Clinton benefited from consistently falling interest rates. Both Presidents George H.W. Bush and George W. Bush were hurt by Fed tightening, an inverted yield curve, and a recession. President Obama benefitted from a benign rate environment (minus a brief moment in 2015-2016) during his term, and President Trump was the unfortunate recipient of tighter policy during his first two years.7
President’s popularity doesn’t matter
Investors don’t have to love what is going on in Washington, DC, to prosper in the markets. In fact, the S&P 500 historically performed the best when the president’s approval rating was in the low range — between 35 and 50.8 That means the market had delivered some of its best returns during periods when half or more of the country didn’t approve of the job the current administration was doing! Still, it’s hard to discern any direct relationship between a president’s popularity, the health of the US economy, and the performance of financial markets.
Markets performed best when presidents weren’t so popular
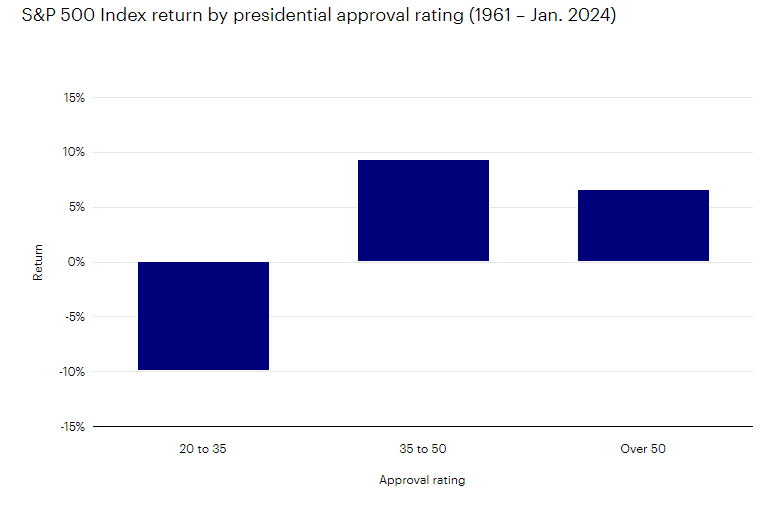
Sources: Bloomberg, L.P. and Gallup, 1/31/24. The presidential approval ratings were introduced to gauge public support for the president of the United States during the term. For illustrative purposes only and not intended as investment advice. An investment cannot be made in an index. Past performance does not guarantee future results.
Investment opportunities continue despite the president
Investors should be less interested in politics and more interested in private-sector business leaders who are going to harness artificial intelligence and robotics. They may be able to help cure debilitating diseases, evolve the nation’s energy sources, and develop new technologies and industries that aren’t even on the radar.
History suggests that innovations — and investment opportunities — will continue irrespective of who wins a presidential election. The period since 2008, for instance, has included Democratic and Republican presidents. Many innovations were introduced during this time including 3D printing, cloud computing, gene editing, and virtual meeting software.
—
Originally Posted August 30, 2024
Will the presidential election affect the stock market? by Invesco US
Footnotes
- Sources: Bloomberg L.P., 11/22/23. Stock market performance is defined by the S&P 500 Index total return from 3/4/1957 to 11/22/23. The S&P 500® Index is a market-capitalization-weighted index of the 500 largest domestic US stocks. An investment cannot be made in an index. Past performance does not guarantee future results.
- Sources: Haver, Invesco, 9/30/23. Real GDP data is from 12/31/2016‒6/30/2023 because GDP is reported with a lag. Gross domestic product (GDP) is a broad indicator of a region’s economic activity, measuring the monetary value of all the finished goods and services produced in that region over a specified period of time.
- Source: Bloomberg L.P., 11/22/23. Financial crisis was George W. Bush presidential term from 1/19/2001-1/20/2009. Stagflationary crisis was Richard Nixon presidential term from 1/20/1969-08/08/1974.
- Sources: Haver, Invesco, 12/31/23. The Dow Jones Industrial Average is a price-weighted index of the 30 largest, most widely held stocks traded on the New York Stock Exchange. An investment cannot be made in an index. Past performance does not guarantee future results.
- Sources: US Bureau of Economic Analysis, 9/30/23 and PEW Research Center, 6/30/23. Substantive bills are defined by PEW as those that have some real-world impact, such as spending bills and setting policy, as opposed to ceremonial bills, which are intended to recognize an individual, group, or cause.
- Source: US Department of Treasury, 6/30/23. Gross domestic product (GDP) is a broad indicator of a region’s economic activity, measuring the monetary value of all the finished goods and services produced in that region over a specified period of time.
- Sources: Goldman Sachs, Bloomberg L.P., 9/30/23.
- Sources: Bloomberg, L.P. and Gallup, 9/30/23. S&P 500 market returns from 1/1/1961 – 9/30/23. An investment cannot be made in an index. Past performance does not guarantee future results
Important information
NA3821340
An inverted yield curve is one in which shorter-term bonds have a higher yield than longer-term bonds of the same credit quality. In a normal yield curve, longer-term bonds have a higher yield.
All investing involves risk, including the risk of loss.
In general, stock values fluctuate, sometimes widely, in response to activities specific to the company as well as general market, economic and political conditions.
The opinions referenced are those of the author as of July 2, 2024, are based on current market conditions, and are subject to change without notice. These opinions may differ from those of other Invesco investment professionals. These comments should not be construed as recommendations but as an illustration of broader themes. Forward-looking statements are not guarantees of future results. They involve risks, uncertainties, and assumptions; there can be no assurance that actual results will not differ materially from expectations.
The document contains general information only and doesn’t take into account individual objectives, taxation position, or financial needs or constitute a recommendation of the suitability of any investment strategy for a particular investor. Investors should consult a financial professional before making any investment decisions. Past performance does not guarantee future results.
Disclosure: Invesco US
This does not constitute a recommendation of any investment strategy or product for a particular investor. Investors should consult a financial advisor/financial consultant before making any investment decisions. Invesco does not provide tax advice. The tax information contained herein is general and is not exhaustive by nature. Federal and state tax laws are complex and constantly changing. Investors should always consult their own legal or tax professional for information concerning their individual situation. The opinions expressed are those of the authors, are based on current market conditions and are subject to change without notice. These opinions may differ from those of other Invesco investment professionals.
NOT FDIC INSURED
MAY LOSE VALUE
NO BANK GUARANTEE
All data provided by Invesco unless otherwise noted.
Invesco Distributors, Inc. is the US distributor for Invesco Ltd.’s Retail Products and Collective Trust Funds. Institutional Separate Accounts and Separately Managed Accounts are offered by affiliated investment advisers, which provide investment advisory services and do not sell securities. These firms, like Invesco Distributors, Inc., are indirect, wholly owned subsidiaries of Invesco Ltd.
©2024 Invesco Ltd. All rights reserved.
Disclosure: Interactive Brokers
Information posted on IBKR Campus that is provided by third-parties does NOT constitute a recommendation that you should contract for the services of that third party. Third-party participants who contribute to IBKR Campus are independent of Interactive Brokers and Interactive Brokers does not make any representations or warranties concerning the services offered, their past or future performance, or the accuracy of the information provided by the third party. Past performance is no guarantee of future results.
This material is from Invesco US and is being posted with its permission. The views expressed in this material are solely those of the author and/or Invesco US and Interactive Brokers is not endorsing or recommending any investment or trading discussed in the material. This material is not and should not be construed as an offer to buy or sell any security. It should not be construed as research or investment advice or a recommendation to buy, sell or hold any security or commodity. This material does not and is not intended to take into account the particular financial conditions, investment objectives or requirements of individual customers. Before acting on this material, you should consider whether it is suitable for your particular circumstances and, as necessary, seek professional advice.
